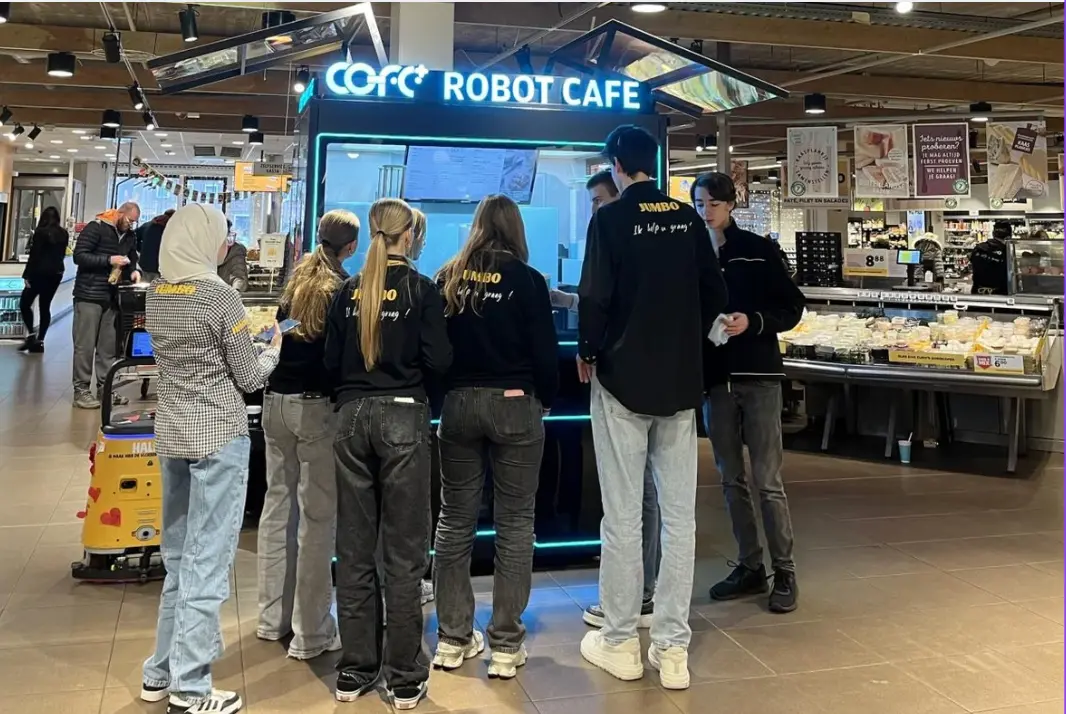
The Rise of Professional Robotic Café Technology: What COFE+ Is and Why It Matters
TL;DR — COFE+ is a fully automated robotic coffee kiosk that grinds fresh beans, brews espresso and lattes, creates latt……

High-volume robot coffee kiosk sites rarely fail on machine reliability. They fail on replenishment timing, and the most common failure is running out of milk, cups, or syrup during the exact window when demand spikes. A robot coffee kiosk can produce roughly 1,000 cups per day, but that number means nothing without SKU-level consumption data tied to hour-of-day patterns. Robot coffee kiosk consumables forecasting at peak volume has to move from fixed calendars to demand signals, location-specific run rates, and remote telemetry. The model below is the one we apply with multi-site operators, and it starts with the baseline most teams skip.
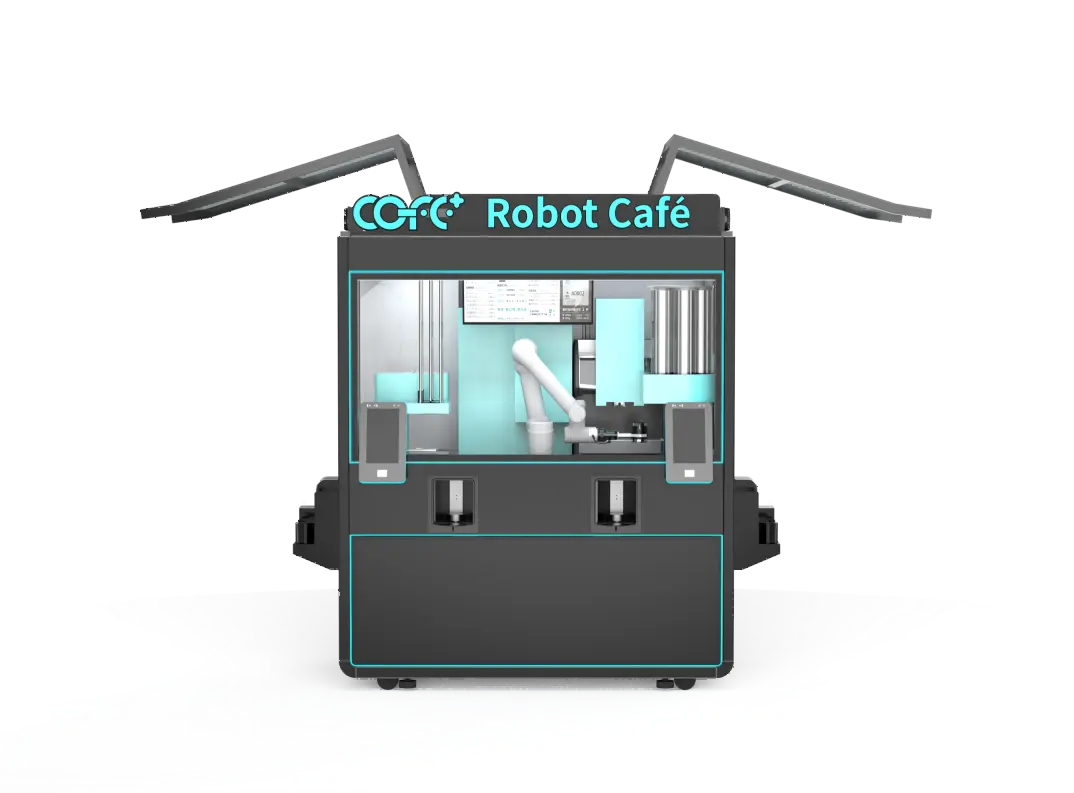
Fixed restocking assumes the kiosk consumes at a stable rate. It does not. A transit-adjacent site may run most of its cups between 06:30 and 09:30, then sit near idle until 16:00. A heatwave can double iced drink consumption at an outdoor unit without changing coffee bean demand by the same margin. In multi-site rollouts we have managed, the first milk shortage usually happens during a hot weekday afternoon because the replenishment cycle was built around average daily sales, not peak-hour demand. That average hides the exact failure point. High-volume robot coffee kiosk forecasting has to start from hour-of-day and location type, not from a monthly order calendar.
At a machine that can reach 1,000 cups per day, the time distribution of those cups matters more than the total. Peak-hour demand drives reservoir and cup magazine sizing, while total daily demand drives replenishment frequency. Operators who separate these two data layers can staff refills and deliveries differently but accurately.
A single consumption number does not control replenishment. Beans, milk, syrups, cups, and lids each have different storage limits, spoilage windows, and delivery lead times. COFE+ equipment carries 300+ drink recipes, 197 country-inspired recipes, and 5,000+ combinations, so aggregate syrup tracking is not enough. Vanilla demand may move independently from caramel, and a single flavored drink can pull from multiple SKUs.
The first step is to build a baseline per SKU from actual telemetry, not from purchase history. Purchase history shows when you ordered, not when you consumed. Telemetry shows the run rate at the ingredient module.
| SKU | Unit | Weekday base rate | Peak-hour multiplier | Primary risk |
|---|---|---|---|---|
| Coffee beans | kg per 100 cups | 0.9 kg | 1.2 to 1.4 | running below 2 kg before refill |
| Milk | liters per 100 cups | 12 L | 1.6 to 2.0 for iced drinks | empty reservoir or spoilage |
| Syrup | bottles per 100 flavored drinks | 4 bottles | 1.3 to 1.5 | flavor-level stockout |
| Cups and lids | pieces per cup | 105 pieces | 1.0 plus waste | mismatched lid supply |
| Water | liters per 100 cups | 8 L | 1.2 to 1.3 | low pressure during peak |
This table is a starting template. The exact values should be pulled from your kiosk model, menu mix, and climate zone.
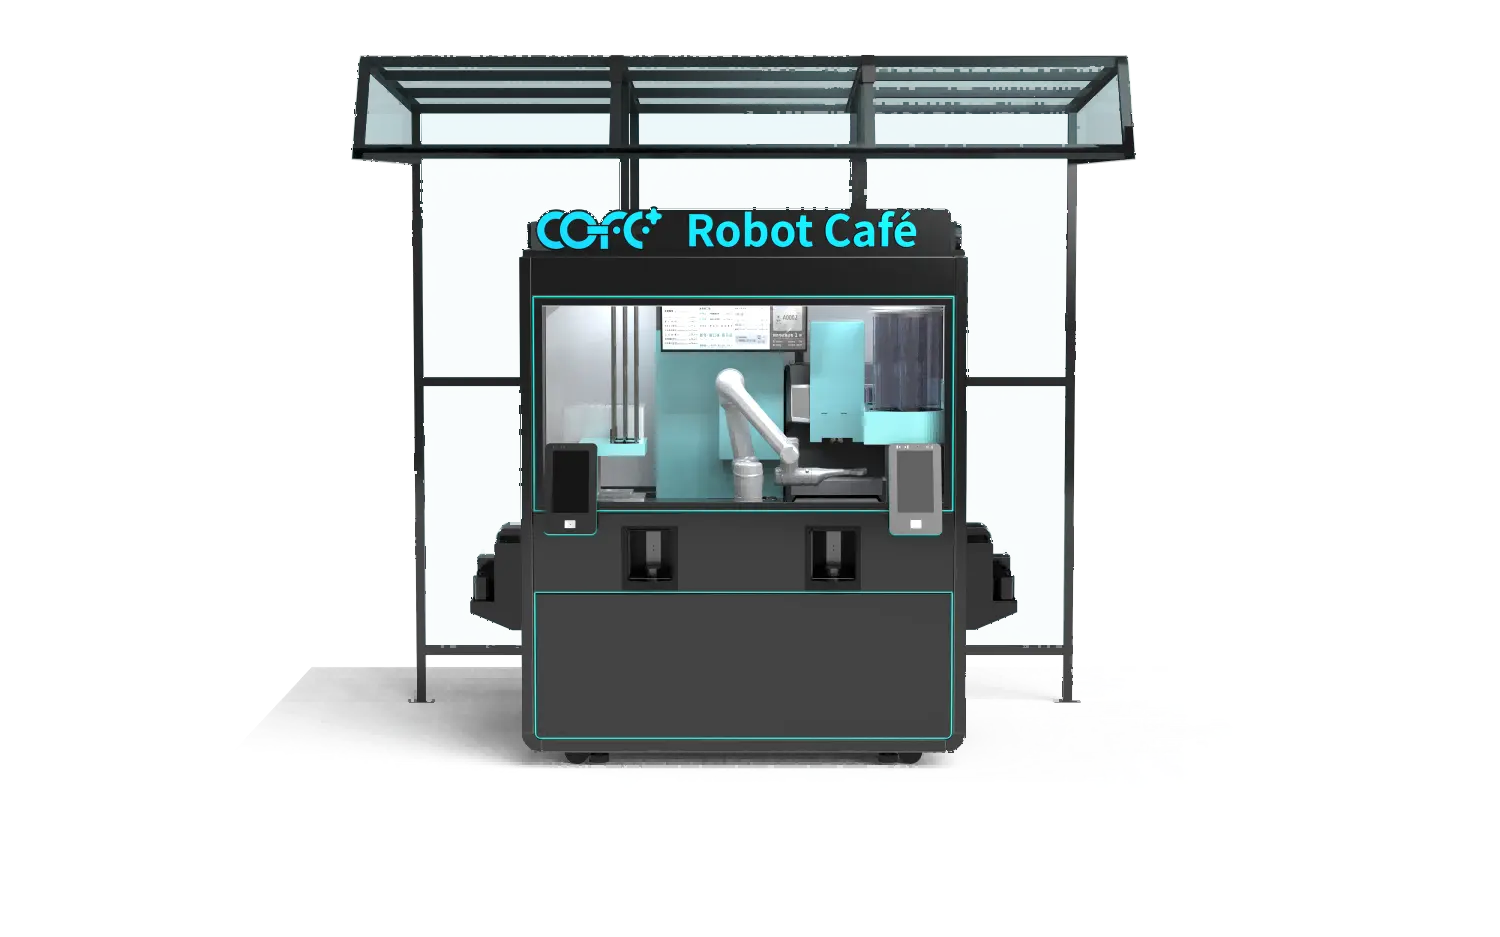
Forecasting becomes useful when it sets a reorder point for each SKU at each robot coffee kiosk site. A reorder point is the inventory level at which a replenishment task should be created, not the level at which the machine runs empty. It must include delivery lead time, the cost of an emergency refill, and the site’s ability to hold extra stock. A small lobby kiosk next to a stockroom may run lean. A remote outdoor unit on a two-day delivery route needs more buffer.
We split sites into three tiers. Tier one covers locations with staff nearby and same-day replenishment. Tier two covers unattended transit or mall sites where emergency refills are expensive but possible. Tier three covers remote outdoor installations where weather, distance, and access restrictions make a stockout a revenue loss of an entire weekend. Each tier uses a different buffer multiple against the same baseline. The forecasting model does not change; the risk weight does.
If your program includes outdoor units, two-day replenishment windows, or limited milk storage, it is worth confirming the exact telemetry fields available in the COFE+ dashboard before finalizing your restocking procedure. Email sales@hi-dolphin.com with your site profile and we will map the alerts to your current workflow.
Most multi-site operators discover the real cost of consumables forecasting after a 24-hour site goes offline for milk during a peak window. If your network runs more than a few machines, combining SKU-level telemetry with site-specific reorder points gives you the control that spreadsheets rarely offer. Send your current site count, machine model, and typical cup-per-day range to sales@hi-dolphin.com, and we will confirm which consumables data fields are available from the COFE+ platform for your operation. You can also call +86 131 6630 1290.
For a site that sells 300 to 500 cups per day, keep at least one full day of peak-hour milk demand as buffer in the machine or adjacent cold storage. Milk is the most fragile SKU because it combines short shelf life, large volume, and high iced-drink dependency. At a high-volume robot coffee kiosk, we usually set the reorder point at 40 percent of daily peak consumption, then add one delivery day if the site is outside a same-day replenishment route. The exact number depends on whether the machine has one reservoir or two.
It depends on what forecasting means. The kiosk’s cloud monitoring system tracks stock, temperature, and system status across remote sites, and it can issue alerts when an ingredient module drops below a set threshold. Automated replenishment logic still works best when an operator sets the threshold using local baseline data, menu mix, and delivery lead time. Spreadsheets remain useful at the pilot stage for testing reorder points, but once a network passes five or six sites, manual tracking becomes slower than the failure you are trying to prevent.
In high-temperature locations we monitor, iced drink syrup and cup lids move faster than coffee beans during a heatwave. The reason is menu mix shifts, not overall demand. A customer who orders an iced latte uses the same coffee dose as a hot latte but more milk, more ice, a different lid, and possibly a flavor syrup. Outdoor robot coffee kiosks face additional load from condensation control and peak cooling, but the consumable risk stays concentrated in the drink components used in cold beverages. Reordering should follow weather-adjusted iced drink share, not just total cups.
A common assumption is that multi-site forecasting requires one analyst per location. That is not how remote telemetry works. A single operations dashboard can group sites by climate zone, menu mix, and delivery tier, then generate refill tasks by exception. The team only needs to intervene when a kiosk crosses a reorder threshold, not when a schedule says so. The real prerequisite is clean SKU mapping and enough local buffer for the longest delivery route. Share your site count and cup-per-day range with sales@hi-dolphin.com, and we will confirm which dashboard fields are available for your network.
TL;DR — COFE+ is a fully automated robotic coffee kiosk that grinds fresh beans, brews espresso and lattes, creates latt……
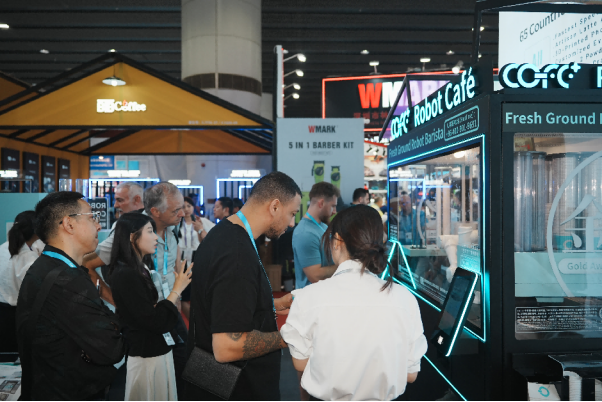
7th-Genertion Smart Robot Coffee Kiosk Arrives at the Belt and Road Core Hub, Ushering in a New Service Era Along t……
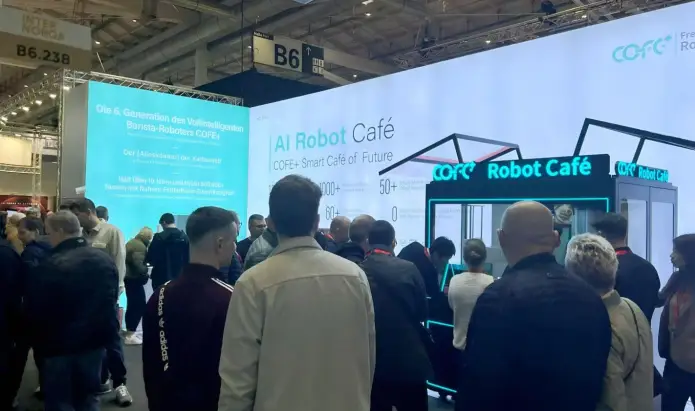
CHICAGO, May 12, 2026 (GLOBE NEWSWIRE) – Shanghai Hi-Dolphin Robot Technology today announced the U.S. debut of its 7th‑……