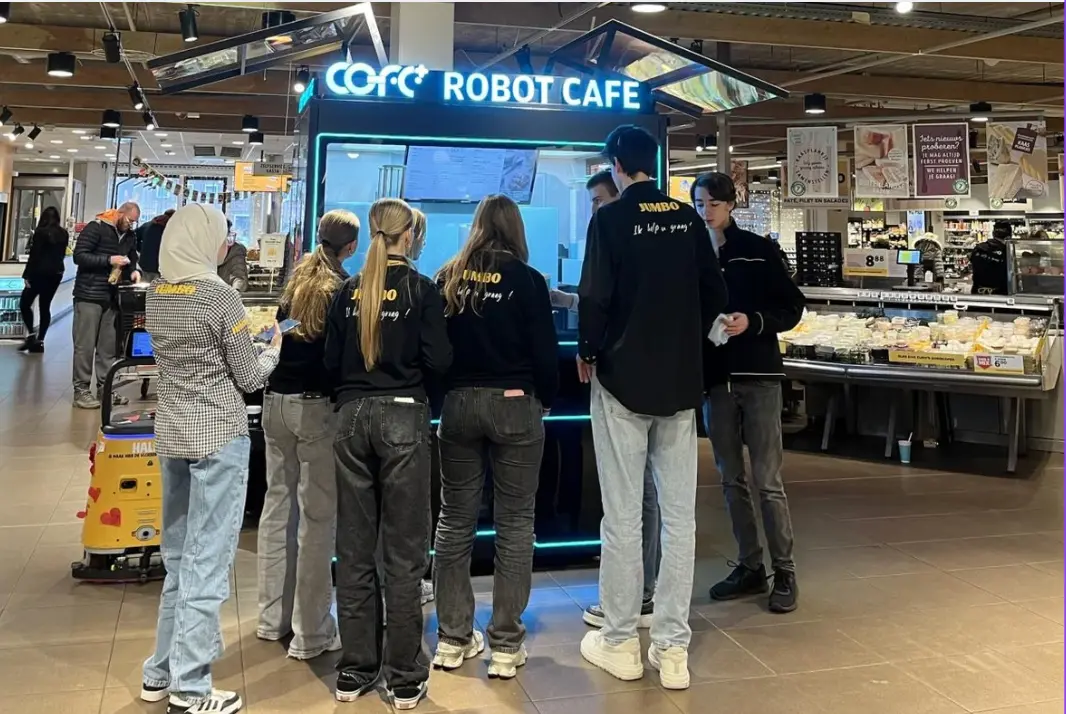
The Rise of Professional Robotic Café Technology: What COFE+ Is and Why It Matters
TL;DR — COFE+ is a fully automated robotic coffee kiosk that grinds fresh beans, brews espresso and lattes, creates latt……

Robot coffee kiosk territory planning determines how you’ll scale and profit, yet too many distributors still rely on estimates and demographic averages rather than the operational data these kiosks generate every hour. A robot coffee kiosk isn’t passive infrastructure; it tracks every cup sold, peak times, and popular customizations, feeding that intelligence back in real time. This guide explains how to shift from paper‑based territory planning to a data‑driven model that improves per‑machine ROI and strengthens your position when negotiating franchise rights. Instead of guessing where demand exists, you build territories around actual consumption patterns, something only automated, self‑reporting equipment makes possible.
Territory planning for a robot coffee kiosk franchise differs fundamentally from planning for a traditional café or vending route. A standard franchise territory might be defined by population count or store count; a robot kiosk territory, however, must account for its unique operating profile: no staff, 24‑hour availability, and minimal square footage. In our global deployments, we’ve seen distributors initially define territories using city‑level population data, only to realize that a single kiosk in a transit hub can outsell three units spread across suburban shopping centers. The key shift is to treat the robot coffee kiosk as a data node first, a profit center second.
This means territory boundaries should be designed around high‑traffic micro‑locations where continuous, unattended service creates the most value—airports, university campuses, industrial parks, and hospital waiting areas, for example—rather than broad geographic zones. A distributor’s territory planning should also account for the machine’s capability to serve 300+ drink varieties and accept multiple payment methods, which broadens the customer base beyond what a single coffee shop would capture.
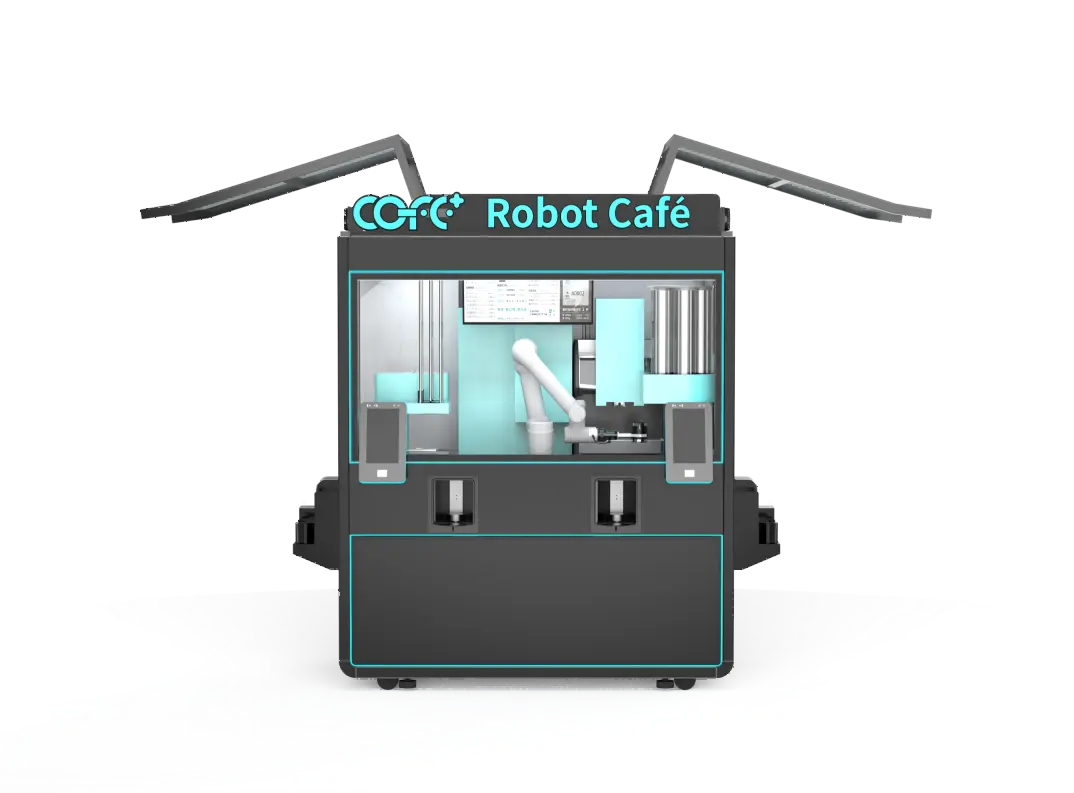
Traditional territory assessment relies on static data: population density, income brackets, and footfall estimates from annual reports. Robot coffee kiosks change that equation. Each kiosk operates as an IoT‑enabled smart station, collecting real‑time data on transaction volumes, time‑of‑day patterns, favorite SKUs, and even environmental factors like temperature that influence demand.
When we work with distributors to optimize territories, we start by looking at the consumption data from existing COFE+ units in comparable regions. A kiosk placed in a Shanghai metro station might show average daily sales of 300 cups, with peaks during morning rush hours, while an outdoor unit in a Dubai park generates more evening and weekend sales. These patterns aren’t just interesting—they directly inform how many kiosks a distributor should deploy per square kilometer of similar urban use. You’re essentially stress‑testing territory boundaries with real‑world performance data before signing a franchise agreement.
Moving from general territory to a workable plan requires a structured approach. We recommend moving through four stages:
Identify high‑potential micro‑locations: Start by mapping your region for sites that have continuous foot traffic but lack convenient coffee access. Stadiums, ferry terminals, highway rest areas, and co‑working spaces are often ignored by traditional coffee chains but are ideal for an unattended kiosk.
Estimate per‑location cup volume using machine benchmarks: COFE+ kiosks can serve up to 1,000 cups per day with a 43–60 second service time. Use that capacity as a ceiling and create realistic estimates based on the expected traffic at each site. A university campus kiosk might reliably deliver 400–600 cups daily during the semester; a quiet business lounge might do 150.
Model revenue and ROI by territory zone: With a cost per cup of roughly $0.30–$0.70 depending on recipe complexity, even a moderate‑volume location can break even quickly. A territory containing five kiosks each selling 250 cups per day at an average ticket of $3–5 can generate substantial monthly revenue, with the total investment typically recovered within 6–12 months per kiosk. Layer in local pricing and ingredient costs to build a territory‑level P&L.
Overlay service logistics and remote monitoring: Because COFE+ machines use cloud‑based monitoring and remote diagnostics, a single territory manager can oversee dozens of kiosks without on‑site staff. The territory plan should account for restocking cycles and technician coverage, but the operational burden is far lower than managing a staffed café chain.
| Factor | Traditional Territory Planning | Data‑Driven Territory Planning |
|---|---|---|
| Territory Boundaries | Based on population and GDP per capita | Based on consumption patterns from live AI analytics |
| Demand Forecasting | Annual surveys | Real‑time sales data and trend prediction |
| ROI Estimation | Rule of thumb | Break‑even calculation using cost per cup and machine capacity |
| Site Selection | Guesswork | Informed by machine utilization simulations across similar deployments |
| Adjustment Speed | Slow (12–24 months) | Immediate (live dashboard) |
If your territory spans mixed‑use locations with varying foot traffic patterns, it is worth simulating your expected daily cup count across different siting scenarios before finalizing your proposal. Reach out at sales@hi-dolphin.com for a data‑backed projection tailored to your region.
Franchisors are more willing to grant exclusive or larger territories when distributors can back their request with performance data. A distributor who presents a territory plan supported by machine‑level consumption projections from existing COFE+ deployments has a stronger negotiating position than one who simply asks for more zip codes.
We advise distributors to approach negotiations with three data points. First, the projected daily cup volume per site, based on benchmarks from similar locations in other regions. Second, the margin analysis showing that even a conservative uptake still delivers a viable payback period. Third, the remote management capability that allows the distributor to efficiently operate more kiosks than a traditional franchise model would permit, reducing the franchisor’s concerns about territory underperformance.
This approach shifts the conversation from “I need more territory” to “Here is why more territory benefits both parties.” It’s a technique that has helped our distributor partners secure exclusive rights in markets from Southeast Asia to the Middle East.
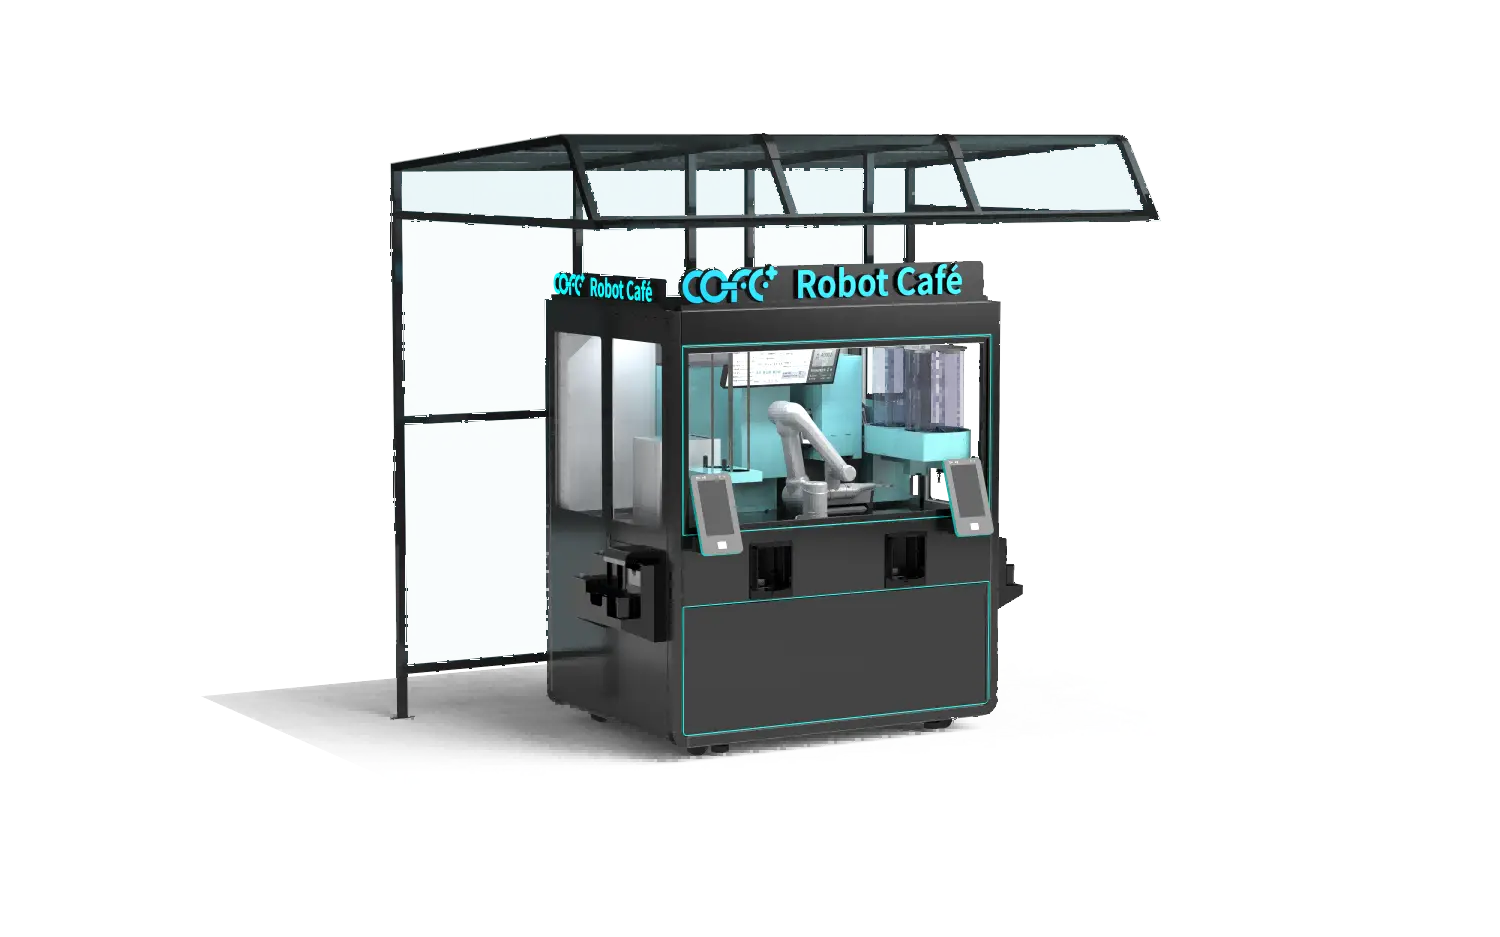
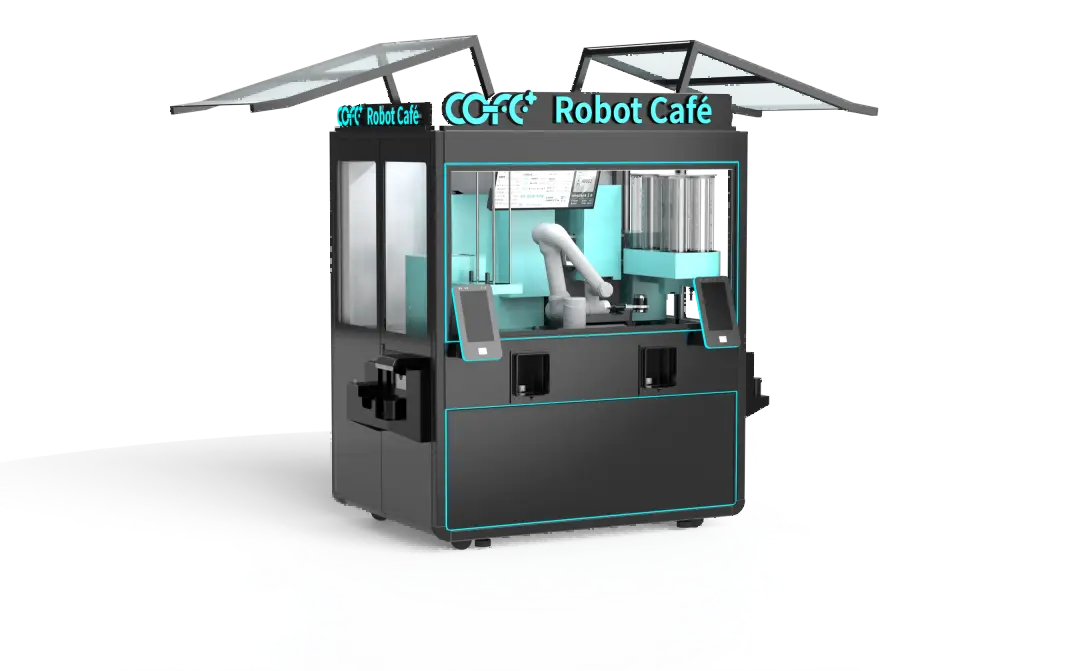
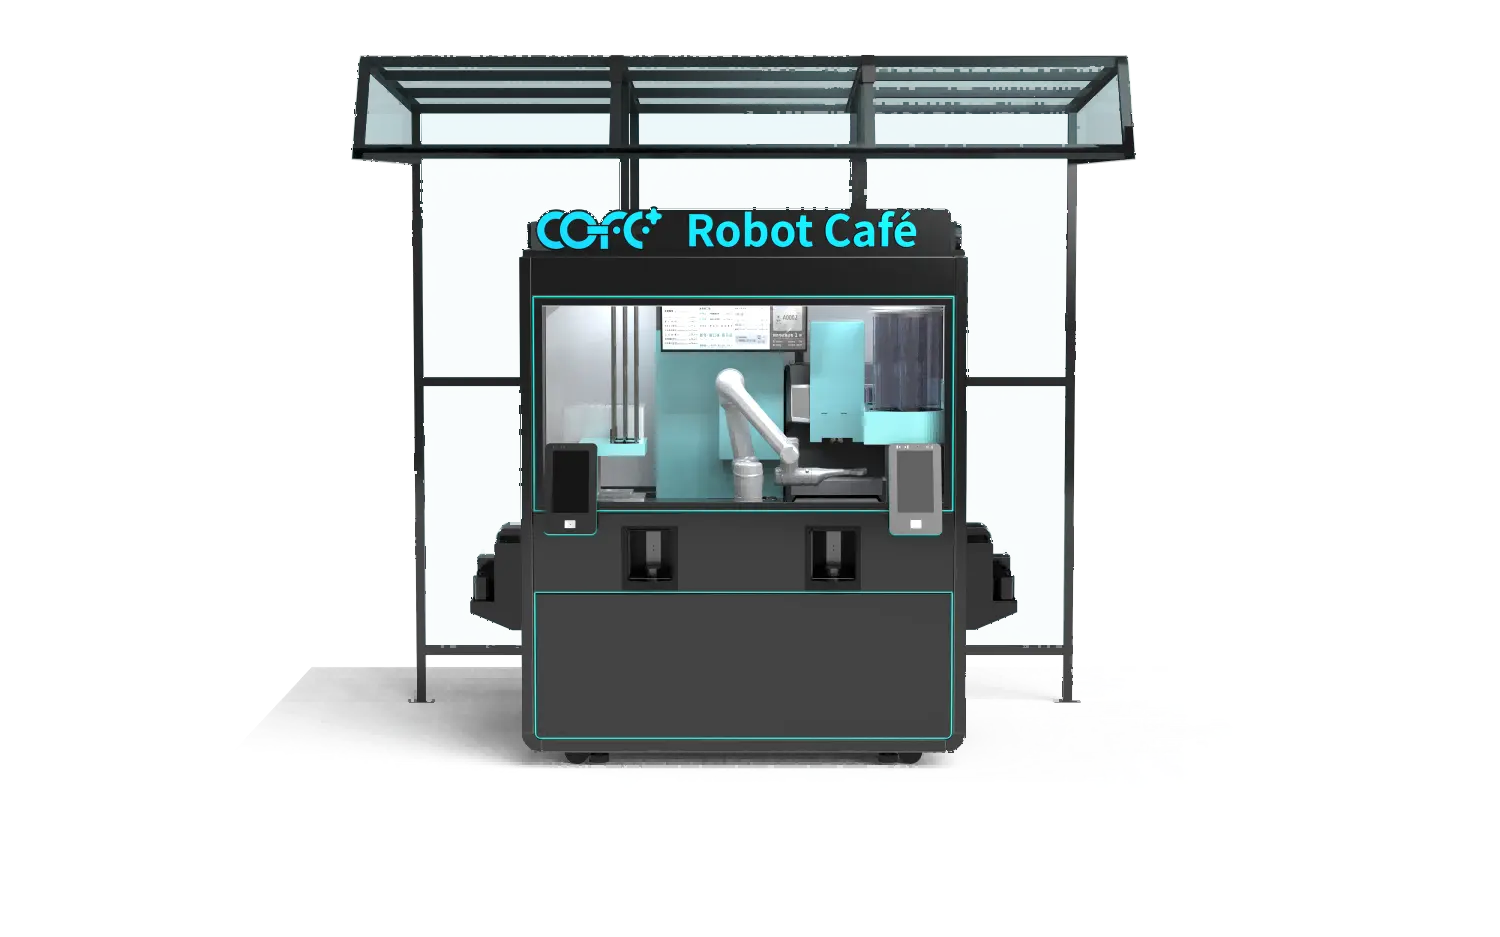
Once territory rights are secured, the deployment sequence matters. Start with a rollout of three to five kiosks in the highest‑density micro‑locations to validate local consumption patterns. COFE+ comes in four form factors: indoor kiosk (2.35 m²), outdoor kiosk (IP54, ‑20 °C to 45 °C), robot coffee bar (transforms into a 4‑seat café), and robot coffee counter (built‑in design). Choosing the right model for each site prevents wasted space and maximizes throughput.
After the first quarter of operation, the cloud dashboard will reveal actual cup sales, peak hours, and drink preferences for each unit. Use that data to adjust the remaining territory rollout: add indoor kiosks in office towers on the same business park loop; place outdoor units at transit stops along a commuter line; convert an underperforming site to a robot coffee bar to attract café seaters. The key is that territory expansion becomes a feedback loop, not a one‑time plan. A territory manager with 15 kiosks can scale to 50 using the same remote oversight infrastructure, a scaling path impossible with staffed coffee shops.
Robot coffee kiosk territory planning fails when distributors treat it as a single decision made once at agreement signing. I have seen three common errors that delay profitability:
Ignoring service corridors: Each kiosk requires periodic restocking and cleaning, even with remote monitoring. Packing too many kiosks into a territory without planning for a technician’s daily drive time creates service backlogs. We map restocking routes as part of the territory design.
Over‑focusing on high‑rent premium spots: A shopping mall anchor might look like a golden placement, but the rent can eat into margins. A quieter, lower‑rent location with steady all‑day traffic—like a factory break area or hospital corridor—often delivers a higher net return per square foot because the labor‑free model makes constant sales the priority, not high single‑ticket value.
Not updating territory assumptions after launch: The first three months of sales data almost always show a different consumption pattern than the original projection. Successful distributors re‑evaluate territory boundaries based on that live data. If a kiosk is consistently at 80 % capacity while another site 2 kilometers away struggles at 30 %, the territory plan should adjust—move a kiosk, or add one where demand outpaces supply. The machines are mobile and can be relocated in hours, not months.
Because robotic kiosks report real‑time sales, ingredient levels, and system health, a distributor can manage a larger territory with fewer staff. A single operations team using the cloud dashboard can oversee 30 or more kiosks, so a territory that would require three regional managers for a traditional café can be run by one. This means you can plan a territory with two to three times the geographic reach of a standard franchise without adding proportional overhead. It is a core structural advantage that should inform your initial territory proposal to the franchisor.
Exclusive territory rights help, but they are not essential if your deployment plan targets locations another distributor is unlikely to reach. We have seen successful non‑exclusive distributors thrive by focusing on underserved niche sites like university libraries, gyms, and corporate cafeterias that the primary territory holder ignored. However, if your strategy relies on deploying kiosks in high‑traffic public retail areas, securing exclusivity prevents another distributor from saturating your prime spots. The data you collect from pilot units is your best leverage in that exclusivity negotiation.
Based on COFE+ performance across 35+ countries, a single kiosk under normal traffic conditions recovers its initial investment in 6–12 months. At the territory level, a cluster of five kiosks deployed with a smart location mix can achieve portfolio break‑even faster because the per‑unit monitoring cost is nearly flat. Exact timelines depend on local pricing and cup volume, but the $0.30–$0.70 per‑cup cost base gives a wide margin band that shortens payback period substantially compared to staffed coffee operations.
Underperforming sites are not a failure—they are a signal to adjust. First, check the cloud data: is the issue low footfall outside certain times, a menu mismatch, or a payment friction? Often, changing the drink menu or adding local flavors increases conversion. If foot traffic is inherently low, the kiosk can be relocated within the territory. These machines are compact and movable, so you are not locked into a bad real estate lease. Relocation should be part of your territory plan from day one, and your data tells you when to pull the trigger. Share your current territory performance metrics with our team at sales@hi-dolphin.com and we’ll help you identify the highest‑potential alternative sites using cross‑market benchmarks.
TL;DR — COFE+ is a fully automated robotic coffee kiosk that grinds fresh beans, brews espresso and lattes, creates latt……
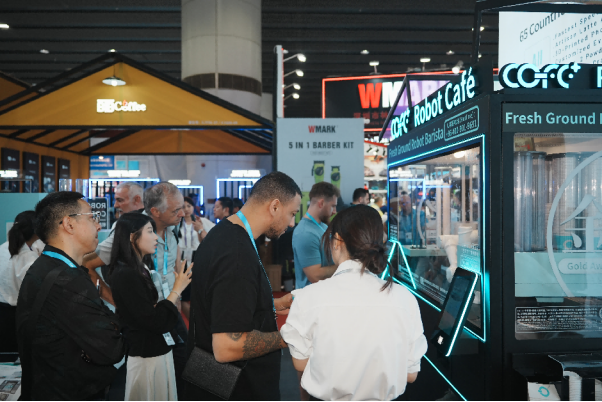
7th-Genertion Smart Robot Coffee Kiosk Arrives at the Belt and Road Core Hub, Ushering in a New Service Era Along t……
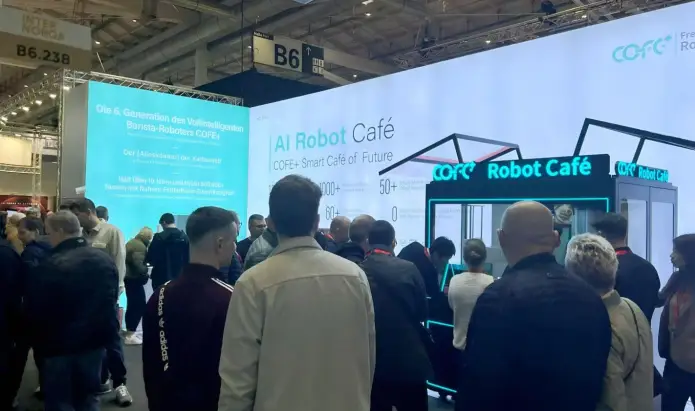
CHICAGO, May 12, 2026 (GLOBE NEWSWIRE) – Shanghai Hi-Dolphin Robot Technology today announced the U.S. debut of its 7th‑……