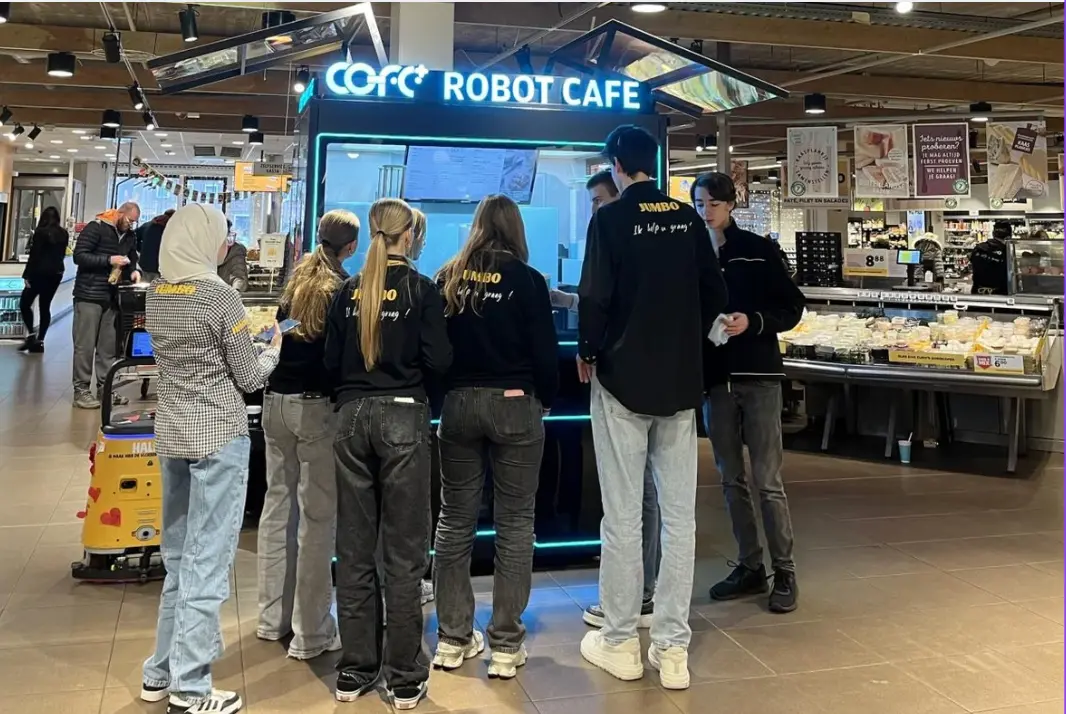
The Rise of Professional Robotic Café Technology: What COFE+ Is and Why It Matters
TL;DR — COFE+ is a fully automated robotic coffee kiosk that grinds fresh beans, brews espresso and lattes, creates latt……

Robot coffee kiosk operations dashboard design fails when it shows too much and tells the owner too little. After watching operators in high foot traffic and quiet lounge sites struggle with the same flooded dashboards, I settled on a shorter list: revenue per hour, stockout lead time, downtime minutes, and a small set of conditional alerts. Owners who track those four signals act faster than teams that monitor every sensor feed. This article maps each metric to the decision it should drive, so you can configure the dashboard before rollout rather than after the first lost weekend.
Most dashboard platforms sell breadth. The owner logs in and sees 40 tiles for motor temperature, water pressure, cup dispenser faults, syrup levels, and door sensor events. That looks like control. In practice, it creates noise. A minority of those signals actually predict revenue loss or service failure, and the rest only matter after an alert has already fired. The result is decision paralysis: the operator sees a red tile, cannot tell whether it threatens the next hundred cups, and starts checking five other screens before acting. A lean dashboard works because it forces a priority order. Every metric either changes an action today or it stays off the main screen.
I have seen this pattern in multi-site operators who expanded from one kiosk to eight without changing dashboard structure. They kept adding alerts until response time slowed down. The fix was not more data, it was a tiered view that surfaces only the metrics that have a financial consequence.
Revenue metrics in a robot coffee kiosk dashboard have one job: show the owner where margin is being made or missed before the end of the week. The four that matter first are revenue per hour, sell through by SKU, average order value, and payment conversion. Traffic data is useful later, but without these four it is hard to separate a weak offer from weak execution.
| Metric | What it reveals | Decision it should drive |
| Revenue per hour | Demand peaks and dead slots | Move restocking and cleaning windows |
| Sell through by SKU | Which drinks slow the line or waste ingredients | Cut slow recipes or reorder them on screen |
| Average order value | Whether bundles and add-ons are working | Adjust prompts and default pairings |
| Payment conversion | Local payment friction or screen confusion | Add local wallets or change default tender |
A kiosk in a transit hub may show strong hourly revenue but weak payment conversion because the default card flow adds one extra step. The dashboard should make that visible in one tile, not in a spreadsheet the owner pulls at month end.
Downtime minutes and stockout lead time are the two operational metrics that translate directly into lost cups. Downtime minutes measure the gap between a failure and the first successful cup after repair. Stockout lead time measures the interval between the first low-stock warning and the moment a replenishment completes. Both matter more than the number of alerts generated.
A kiosk that runs out of oat milk on a Monday morning does not lose one sale, it loses the whole morning routine of customers who chose the kiosk for plant-based drinks. That is why the dashboard should track stockout risk at the SKU level and estimate hours to empty, not just units remaining. Cleanliness intervals, waste rates, and ingredient age belong on the second screen. They are useful for compliance and quality, but they should not crowd out the signals that stop immediate revenue loss.
If your portfolio mixes indoor and outdoor kiosks, do not assume the same alert logic applies. Outdoor condensation alarms and indoor syrup temperature alarms carry different failure consequences. If you are finalizing an operations dashboard now, it is worth confirming your sensor thresholds with a provider before rollout. You can send your site list and expected cup volume to sales@hi-dolphin.com.
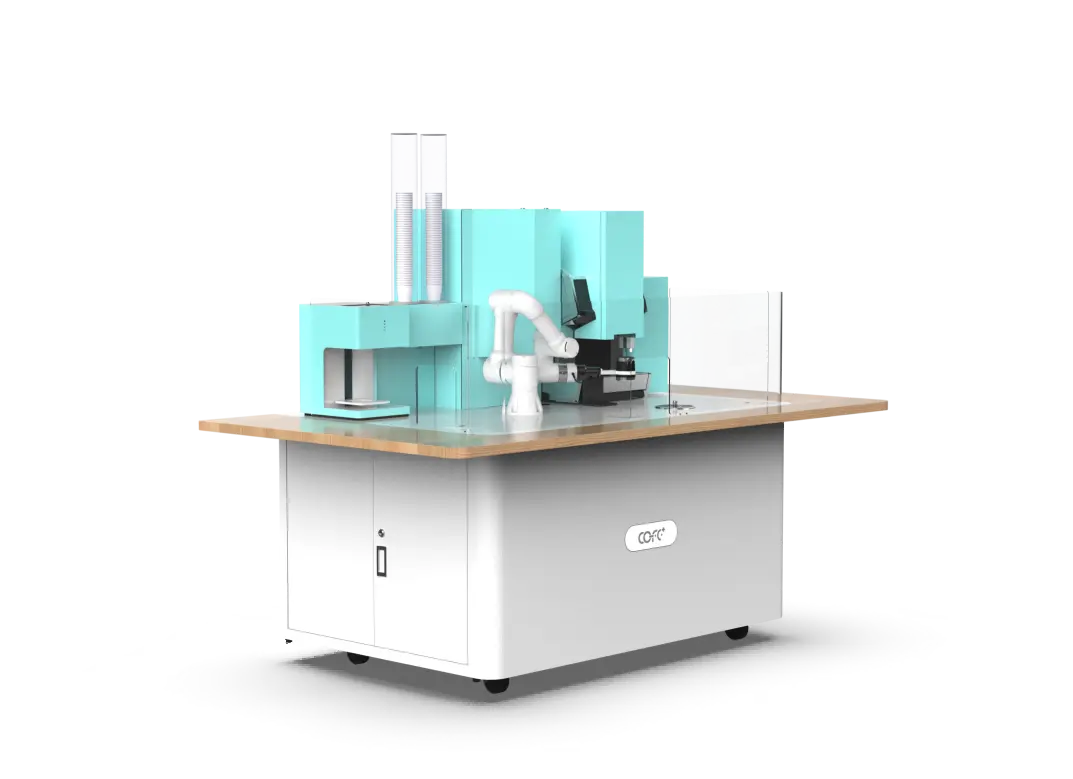
The default factory alert is usually too sensitive or too late. Sensitive alerts create alarm fatigue, late alerts create stockouts. A better approach is to split alerts into warnings and critical events, and assign each a specific owner action. The COFE+ cloud monitoring stack handles the data collection, but the operating thresholds still belong to the owner.
They set the threshold at the point of failure rather than the point of decision. For example, a stock alert at 5 percent remaining may leave enough time for a local technician to restock tomorrow; it may not leave enough time if the site is a 90 minute drive from the supplier. The threshold must be set backwards from the replenishment travel time, not from the machine limit.
A critical alert should mean one thing: a revenue interruption is happening or is certain within the next hour. That includes the bean hopper empty, water supply failure, the payment terminal offline, or a module fault that stops cup dispensing. Temperature drift, low cup inventory, and routine cleaning reminders are warnings. They deserve attention, but they do not justify waking an operator at 2 a.m.
The dashboard is only useful if the Friday review ends with a specific action: move a restock window, cut a menu item, or dispatch a technician. Owners who treat the dashboard as a report card react after the loss has already happened. The ones who treat it as a dispatch tool shorten the gap between signal and response.
Every site should have three standing rules. First, no metric stays on the main screen unless it changes an action within 24 hours. Second, any critical alert that fires twice in a week generates a root cause review, not just a reset. Third, underperforming sites get thirty days of dashboard evidence before a relocation decision. That is enough time to see whether the problem is demand, placement, or execution.
If you are setting up a new dashboard and do not want to learn threshold logic through costly stockouts, send your expected daily cup volume and site type to sales@hi-dolphin.com or call +86 131 6630 1290. We will recommend a metric set before any quote discussion.
A main screen should hold no more than seven to nine metrics. The visible set should be limited to the numbers that change an operational decision within 24 hours, such as revenue per hour, downtime minutes, stockout risk, and active critical alerts. Everything else belongs in a second screen for weekly review. Owners err in both directions: some watch one cup counter and miss maintenance risks, while others display 40 tiles and stop looking. The right number is the smallest set that covers revenue, stock, machine health, and payment status.
No. A sales report is backward looking and usually reviewed weekly or monthly. An operations dashboard is forward looking and designed to prevent revenue loss before it appears in the sales report. A sales report will show that Tuesday revenue fell. The operations dashboard should have shown why Tuesday was at risk while there was still time to restock or dispatch a technician. Keeping the two separate matters because sales totals rarely tell you which hour, machine, or recipe caused the change.
It depends on the metric. If the warning tracks ingredient stock and the site is far from replenishment, treat it as critical and act before the stockout lead time closes. If the warning tracks a slow temperature drift inside normal range, record it and watch the trend. Do not ignore warnings just because they are not critical, but do not treat every one as urgent. The dashboard should label which warnings have a financial consequence if left open.
In outdoor deployments we have supported, the alert set changes because the environment creates different failure paths. Outdoor units need condensation, extreme temperature, and dust exposure monitoring earlier than indoor units. The core metrics stay the same: revenue per hour, stockout lead time, downtime minutes. The difference is in which warnings lead to a critical event and how fast. Send your site mix and peak hour data to sales@hi-dolphin.com and we will confirm which alerts should sit on your main screen.
TL;DR — COFE+ is a fully automated robotic coffee kiosk that grinds fresh beans, brews espresso and lattes, creates latt……
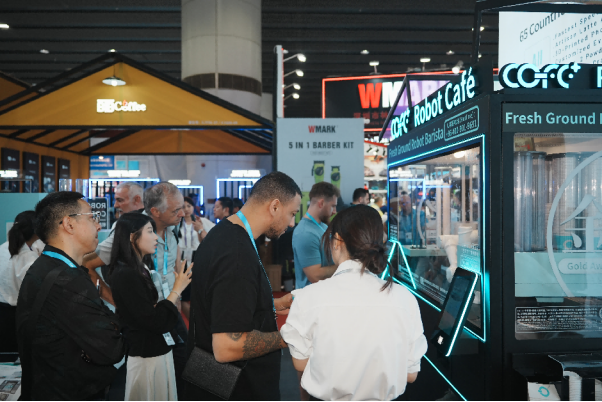
7th-Genertion Smart Robot Coffee Kiosk Arrives at the Belt and Road Core Hub, Ushering in a New Service Era Along t……
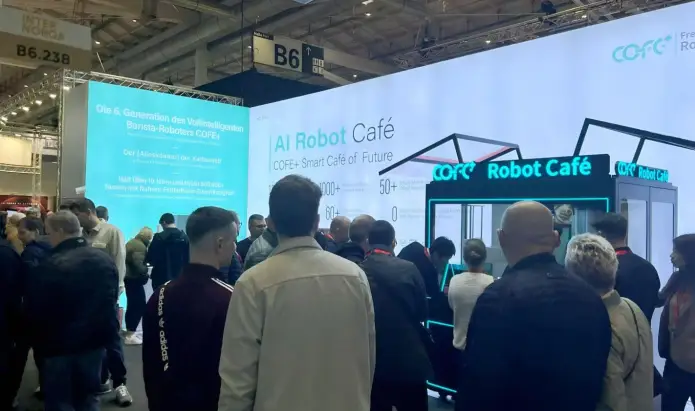
CHICAGO, May 12, 2026 (GLOBE NEWSWIRE) – Shanghai Hi-Dolphin Robot Technology today announced the U.S. debut of its 7th‑……