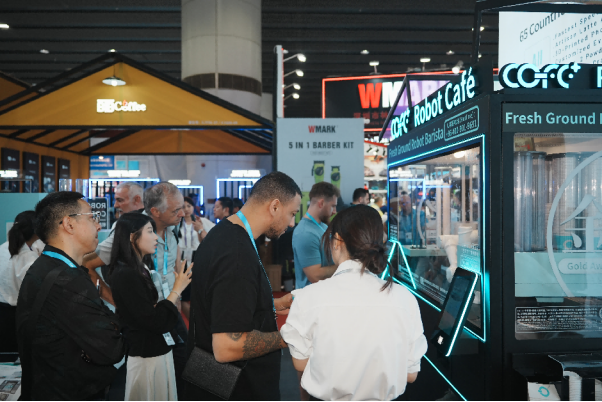
World’s No.1 Robot Café COFE+ Makes Its Debut at Urumqi Diwopu International Airport in Xinjiang
7th-Genertion Smart Robot Coffee Kiosk Arrives at the Belt and Road Core Hub, Ushering in a New Service Era Along t……
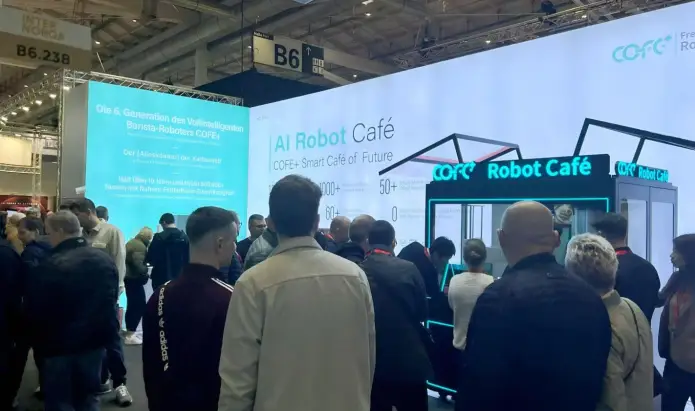
Most operators evaluating robot coffee kiosks fixate on equipment cost while underestimating how dramatically the cost structure differs from traditional café economics. A robot coffee kiosk reaches break-even faster not because it sells more cups, but because it eliminates the single largest variable cost in food service: labor. With per-cup production costs between $0.30 and $0.70, zero staffing requirements, and 24-hour operation capability, the payback calculation fundamentally changes. I’ve worked through these numbers with operators across 65+ countries, and the pattern is consistent: those who model break-even using traditional café assumptions miss the timeline by 12 to 18 months.
Traditional coffee shop break-even analysis assumes labor costs consume 25% to 35% of revenue. This assumption collapses entirely with robot kiosk operations. When you remove barista wages, shift scheduling, training costs, and employee turnover expenses, the entire cost structure shifts toward fixed equipment investment and consumables.
A conventional café serving 300 cups daily might employ 4 to 6 staff members across shifts. At minimum wage levels in developed markets, this represents $8,000 to $15,000 monthly in labor costs alone. A robot kiosk serving the same volume operates with zero labor expense beyond occasional restocking visits.
The second modeling failure involves operating hours. Traditional cafés operate 12 to 16 hours daily due to staffing constraints. Robot kiosks operate 24 hours without additional cost. This extends revenue capture into early morning, late night, and overnight periods that traditional operators cannot profitably serve.
| Cost Category | Traditional Café (Monthly) | Robot Kiosk (Monthly) |
|---|---|---|
| Labor | $8,000 – $15,000 | $0 |
| Rent (per sq ft) | $2,000 – $5,000 (400+ sq ft) | $300 – $800 (25 sq ft) |
| Utilities | $500 – $1,200 | $150 – $300 |
| Consumables | $2,500 – $4,000 | $2,000 – $3,500 |
| Operating Hours | 12-16 hours | 24 hours |
Break-even timing depends on four interconnected variables: equipment cost, daily cup volume, average selling price, and per-cup production cost. Manipulating any single variable shifts the timeline significantly.
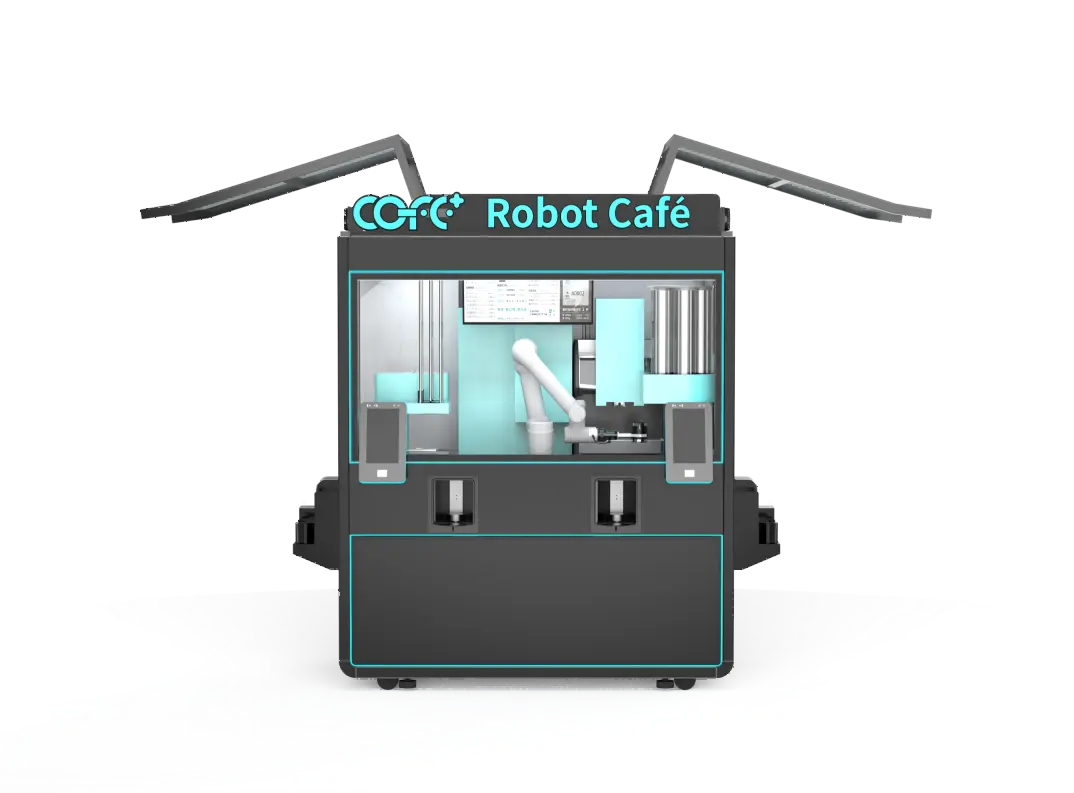
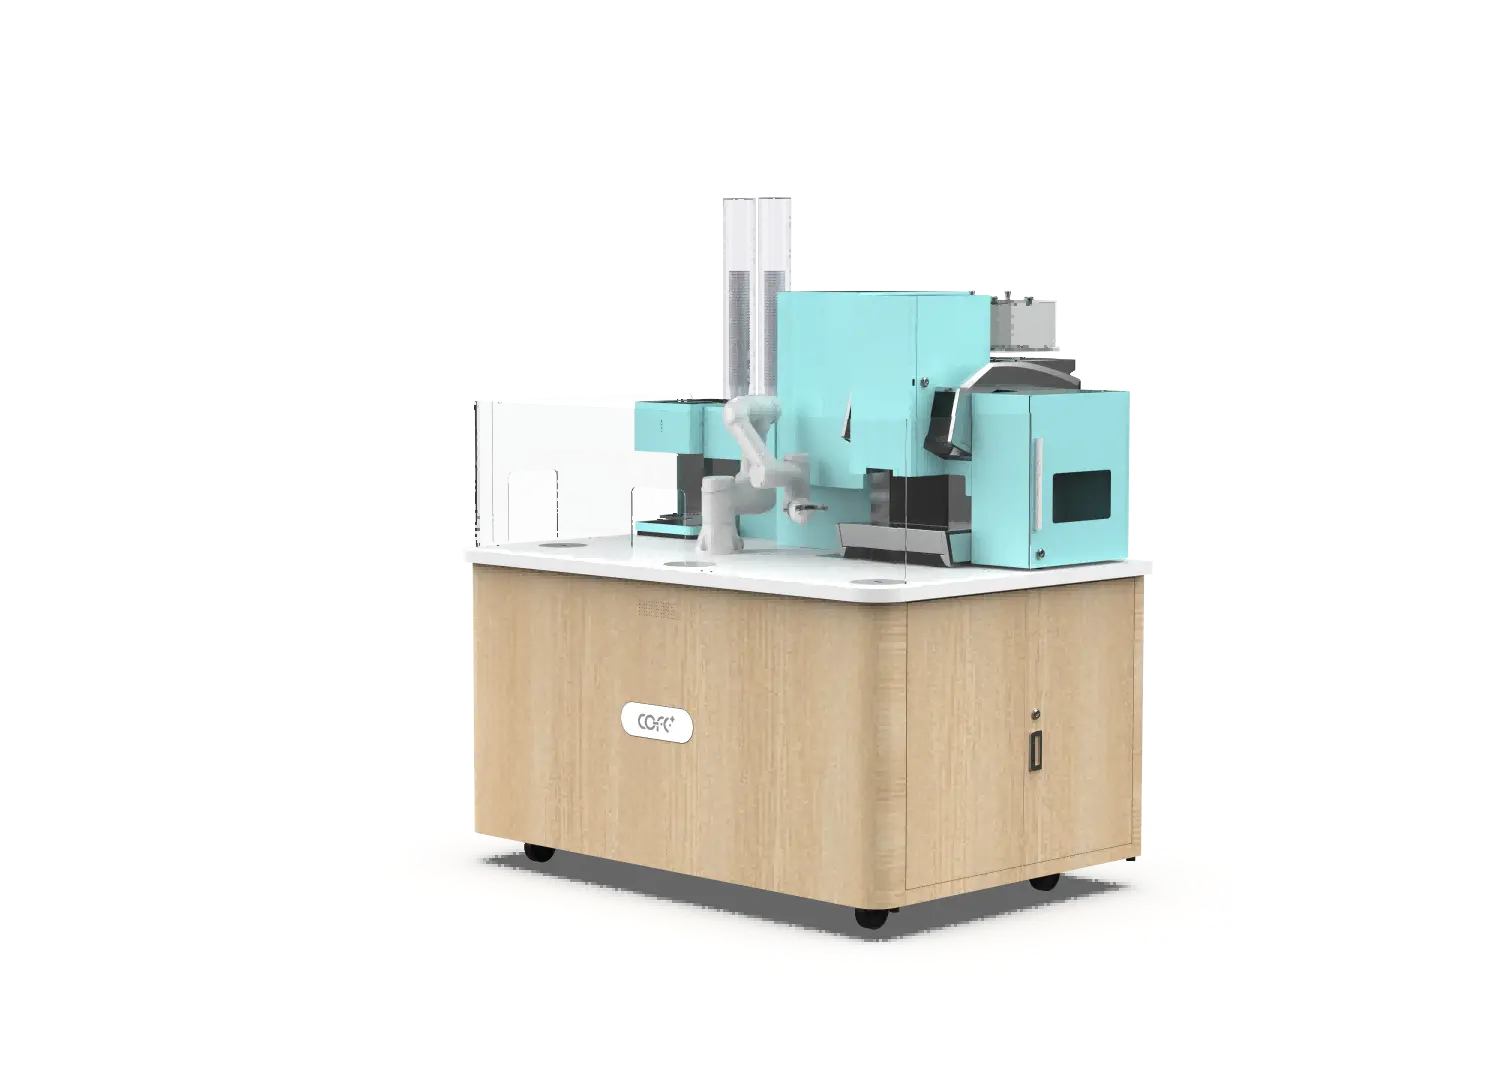
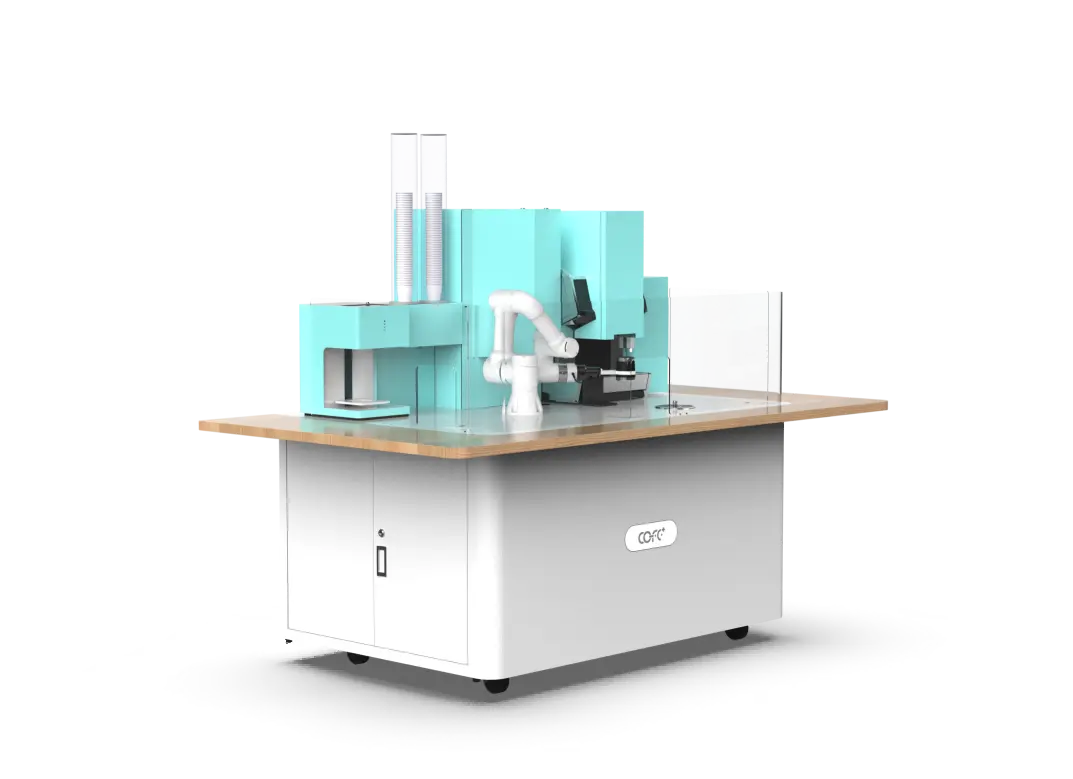
COFE+ 7th generation robot kiosks represent a one-time capital expenditure. Unlike traditional café buildouts requiring $150,000 to $300,000 for equipment, furniture, renovation, and initial inventory, a robot kiosk arrives as a complete operational unit. The 2.35 square meter footprint eliminates renovation costs entirely in most deployments.
Volume projections must account for 24-hour operation. A high-traffic mall location might serve 200 cups during traditional business hours but capture an additional 50 to 100 cups during extended evening and early morning periods. Airport deployments routinely serve passengers during hours when all staffed vendors are closed.
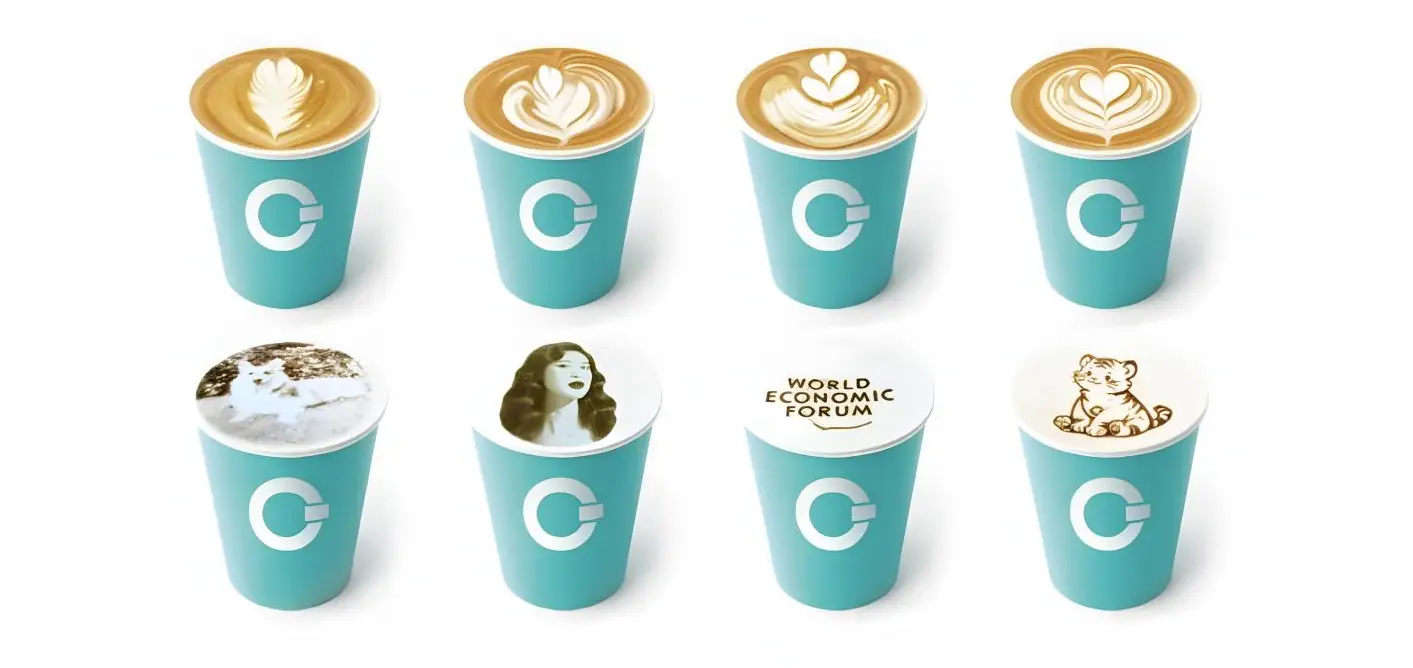
Robot kiosks command premium pricing in most markets. The novelty factor, consistent quality, and 3D latte art capabilities justify prices 10% to 20% above nearby traditional vendors. I’ve observed operators in European airports pricing robot-made specialty drinks at €5.50 to €7.00 without resistance.
With production costs between $0.30 and $0.70 per cup depending on drink complexity and local ingredient costs, gross margins typically exceed 70%. This margin structure accelerates break-even dramatically compared to traditional cafés operating at 55% to 65% gross margins.
The payback calculation follows a straightforward formula, but the inputs require careful consideration of your specific deployment context.
Monthly Gross Profit = (Average Price × Daily Volume × 30) – (Per-Cup Cost × Daily Volume × 30) – Monthly Operating Costs
Payback Period = Equipment Investment ÷ Monthly Gross Profit
Consider a shopping mall deployment scenario:
– Average selling price: $4.50
– Daily volume: 150 cups
– Per-cup cost: $0.50
– Monthly rent and utilities: $600
Monthly revenue: $4.50 × 150 × 30 = $20,250
Monthly consumables: $0.50 × 150 × 30 = $2,250
Monthly operating costs: $600
Monthly gross profit: $20,250 – $2,250 – $600 = $17,400
At this profit level, equipment payback occurs within 6 to 12 months depending on the specific model and configuration selected.
The calculation changes substantially with volume. At 250 daily cups, monthly gross profit approaches $30,000, compressing payback to under 6 months in optimal conditions.
Location determines volume, and volume determines break-even speed. The robot kiosk format opens deployment options that traditional cafés cannot access profitably.
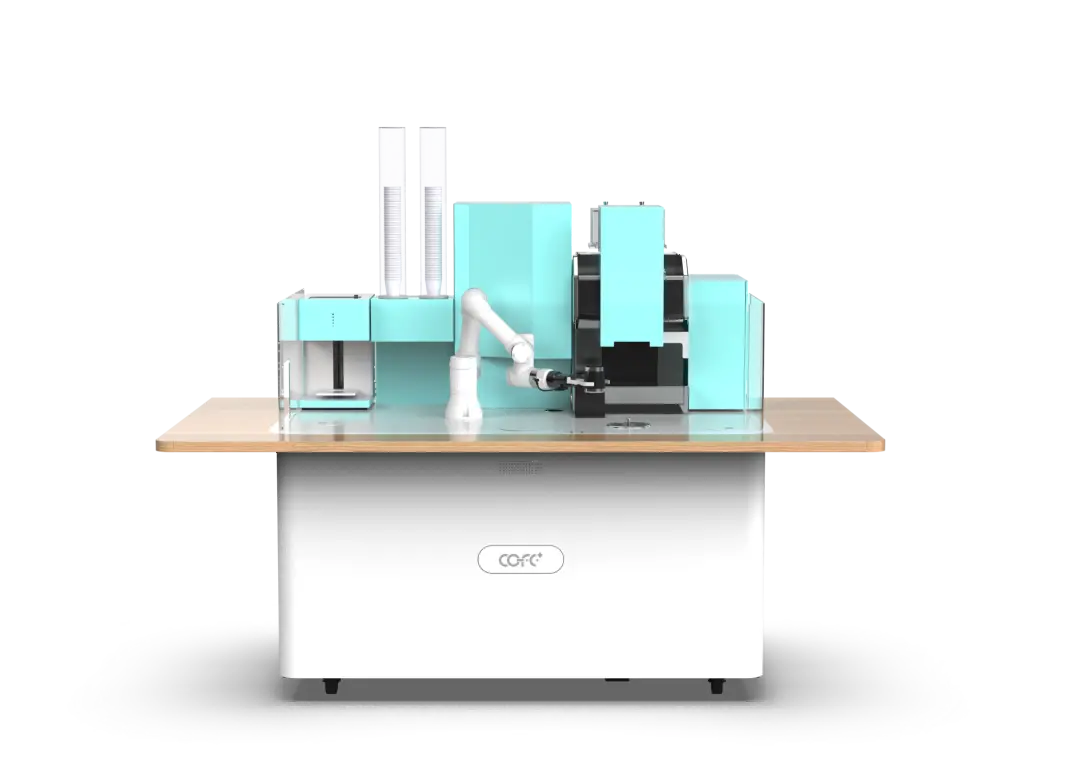
Shopping malls, office building lobbies, and university common areas deliver consistent weekday volume. The compact 2.35 square meter footprint fits spaces too small for traditional café operations, often at lower rental rates per square foot.
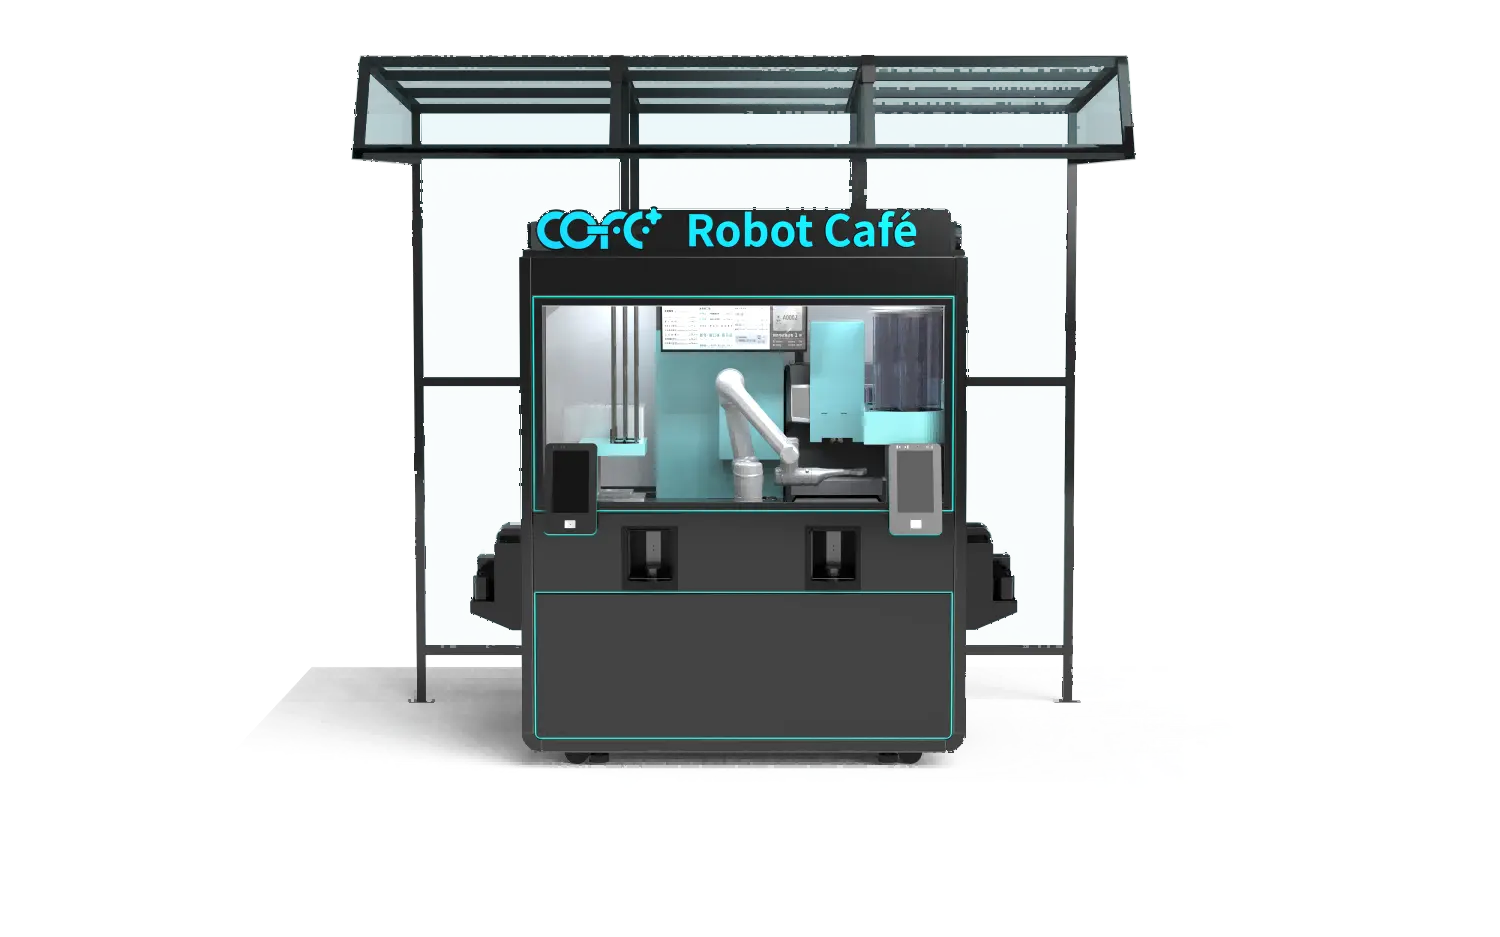
The outdoor robot coffee kiosk variant operates from -20°C to 45°C with IP54 protection. This opens gas stations, transit hubs, parks, and street-side locations where traditional café infrastructure costs would be prohibitive. I’ve seen outdoor units in Middle Eastern markets operating through summer heat that would shut down conventional equipment.
Hospitals, airports, train stations, and 24-hour fitness centers generate revenue during hours when labor costs make traditional café operation unprofitable. A robot kiosk at a regional hospital serves night-shift nurses, overnight visitors, and early-morning patients without incremental labor cost.
| Location Type | Typical Daily Volume | Break-Even Range |
|---|---|---|
| Shopping Mall | 150-250 cups | 6-10 months |
| Airport Terminal | 200-400 cups | 4-8 months |
| Office Building | 100-200 cups | 8-14 months |
| University Campus | 150-300 cups | 5-9 months |
| Hospital | 100-180 cups | 9-14 months |
Several factors outside the basic calculation materially affect actual break-even timing.
The 300+ drink menu with 5,000+ customization options enables upselling that increases average ticket value. Specialty drinks with 3D latte art or robotic arm designs command $1.00 to $2.00 premiums over basic espresso drinks. Operators who actively promote premium options through the touchscreen interface see 15% to 25% higher average tickets.
The 10-year design life and 500,000+ cup durability testing means maintenance costs remain predictable. Automatic cleaning cycles reduce consumable waste compared to manual barista operations where over-dosing and spillage are common. Cloud monitoring enables remote diagnostics, reducing service call frequency.
Unlike fixed cafés with stable staffing costs regardless of volume, robot kiosks capture seasonal peaks without incremental expense. A unit near a stadium generates extraordinary volume on event days. A tourist-area deployment peaks during holiday seasons. These volume spikes accelerate break-even without the staffing headaches that plague traditional operators during peak periods.
Not every deployment hits the 6 to 12 month target. Understanding failure modes helps operators avoid common mistakes.
Low-traffic locations remain the primary cause of extended payback periods. A robot kiosk in a quiet office building with 50 daily cups will take 24+ months to break even. The technology cannot compensate for fundamental location selection errors.
Pricing timidity also extends payback. Operators who price at or below nearby traditional cafés leave margin on the table. The robot format justifies premium pricing; failing to capture that premium extends the timeline unnecessarily.
Poor menu promotion represents a third failure mode. Operators who leave the default menu configuration without highlighting high-margin specialty drinks miss upselling opportunities that materially affect monthly profit.
The break-even calculation provides a framework, but the decision requires honest assessment of your specific situation. If you have access to a high-traffic location with reasonable rent, the math typically works within 12 months. If your location delivers 200+ daily cups, payback compresses to 6 months or less.
The 90% labor cost reduction compared to traditional café operations represents the fundamental economic advantage. Every cup sold generates margin that flows directly to equipment payback rather than payroll.
For operators evaluating specific locations or configurations, the variables in your break-even model depend on local market conditions, rental rates, and realistic volume projections. Share your target location details and expected daily volume with our team at sales@hi-dolphin.com or +86 131 6630 1290, and we can work through the payback calculation for your specific scenario.
Financing spreads the capital expenditure across monthly payments, which changes the cash flow profile but not the fundamental economics. With financing, operators reach cash-flow positive faster since they’re not waiting to recover a large upfront payment. The total cost of ownership increases due to interest, but many operators prefer the improved cash flow position. If your deployment generates $15,000+ monthly gross profit, financing payments typically represent a small fraction of that figure, making the unit profitable from month one on a cash-flow basis.
Volume sensitivity is the most important factor to stress-test in your model. At 100 daily cups instead of 150, break-even extends from 8 months to approximately 14 months. At 75 daily cups, you’re looking at 18+ months. The fixed cost structure means volume drops hit profitability harder than in traditional cafés where you might reduce staff hours. Before committing to a location, spend time counting foot traffic and observing purchasing patterns at nearby food service vendors.
Multi-unit operators often achieve faster system-wide break-even because they optimize across locations. A high-performing mall unit generating $25,000 monthly profit can subsidize a slower office building unit while it builds volume. The cloud-based management system makes monitoring multiple units straightforward. Operators running 3+ units also gain purchasing leverage on consumables and can negotiate better rental terms. If you’re considering a multi-unit strategy, it’s worth discussing territory arrangements and volume pricing before your first deployment.
Post break-even, monthly costs stabilize around consumables (coffee beans, milk, cups, syrups), rent, utilities, and periodic maintenance. Consumables scale directly with volume at $0.30 to $0.70 per cup. Maintenance costs remain minimal due to the 500,000+ cup durability design, but budgeting $200 to $400 monthly for preventive maintenance and occasional part replacement is prudent. The absence of labor costs means your post break-even profit margin remains exceptionally high compared to traditional café operations.
Volume projection accuracy determines whether your break-even calculation reflects reality. Count foot traffic at different times and days. Observe purchasing behavior at nearby food vendors. Consider the competitive landscape and whether existing options are convenient or create an opening for a 24-hour automated alternative. If you share your target location details with our team, we can reference performance data from similar deployments across our 65+ country network to help calibrate your projections. Contact sales@hi-dolphin.com with your location specifics.
7th-Genertion Smart Robot Coffee Kiosk Arrives at the Belt and Road Core Hub, Ushering in a New Service Era Along t……
CHICAGO, May 12, 2026 (GLOBE NEWSWIRE) – Shanghai Hi-Dolphin Robot Technology today announced the U.S. debut of its 7th‑……
SHANGHAI, April 1, 2026 (GLOBE NEWSWIRE) — Shanghai Hi-Dolphin Robot Technology Co., Ltd. (“Hi-Dolphin Robotics”) ……