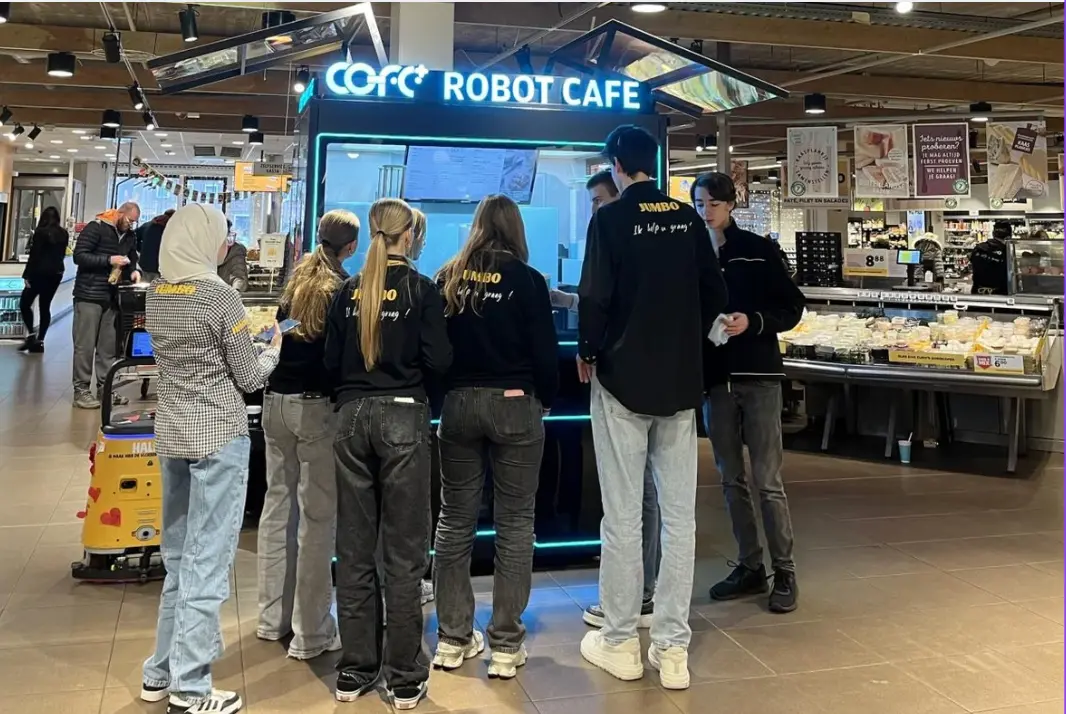
The Rise of Professional Robotic Café Technology: What COFE+ Is and Why It Matters
TL;DR — COFE+ is a fully automated robotic coffee kiosk that grinds fresh beans, brews espresso and lattes, creates latt……

Most revenue models for automated retail treat a robot coffee kiosk like a traditional vending machine, applying the same footfall conversion rates and static margins across all site types, which produces numbers that look clean on a spreadsheet but collapse in the real world. I have built financial projections for robot coffee kiosk deployments across transit hubs, university campuses, office towers, and outdoor public plazas, and the single largest error I see in early-stage estimates is treating cup output as the only variable that matters. A robot coffee kiosk is not a simpler vending unit with better margins; it is a category that requires its own revenue logic, driven by location time-of-use patterns, menu composition, payment flow latency, and the operational costs that disappear when no barista is on payroll. This walkthrough addresses the revenue estimation gap that most generic ROI calculators ignore, giving operators a granular model they can adapt to a specific site within an hour, not a week of guesswork.
Revenue estimation for a robot coffee kiosk begins with five interconnected variables, not one headline throughput number. The first is hourly demand profile, which is not the same as daily footfall. A kiosk in a metro station might need to serve 90 cups between 7:30 and 9:00 AM and then sit nearly idle for three hours, while a hospital lobby sees a steady 20 cups per hour across 18 hours. A model that assumes a flat 10-hour serving day will overestimate revenue at the metro station by ignoring peak compression losses and underestimate it at the hospital. The second variable is average order value (AOV), which in a robotic environment is shaped by the menu hierarchy and upsell path on the touchscreen, not by barista suggestion. The third is service time per cup, which determines the hard ceiling on peak-hour throughput. The COFE+ 7th generation unit I work with delivers a cup in 43 to 60 seconds depending on the drink complexity, meaning a single machine can clear roughly 60 to 80 cups in a peak hour if the ordering interface does not introduce friction. The fourth variable is downtime for replenishment and cleaning, which in unmanned kiosks is measured in minutes per day rather than shift handovers but still bites into available serving hours. The fifth is seasonal demand swing, which in outdoor locations can shift monthly revenue by 40% or more between summer and winter.
The relationship among these variables is multiplicative, not additive, so a 10% error in AOV and a 10% error in effective serving hours does not produce a 20% revenue miss; it produces a 21% gap, and compounding three small errors quickly breaks a business plan. I have seen distributors build revenue models using only daily cup count and a fixed price assumption, which is the fastest way to look right on paper and wrong by month three.
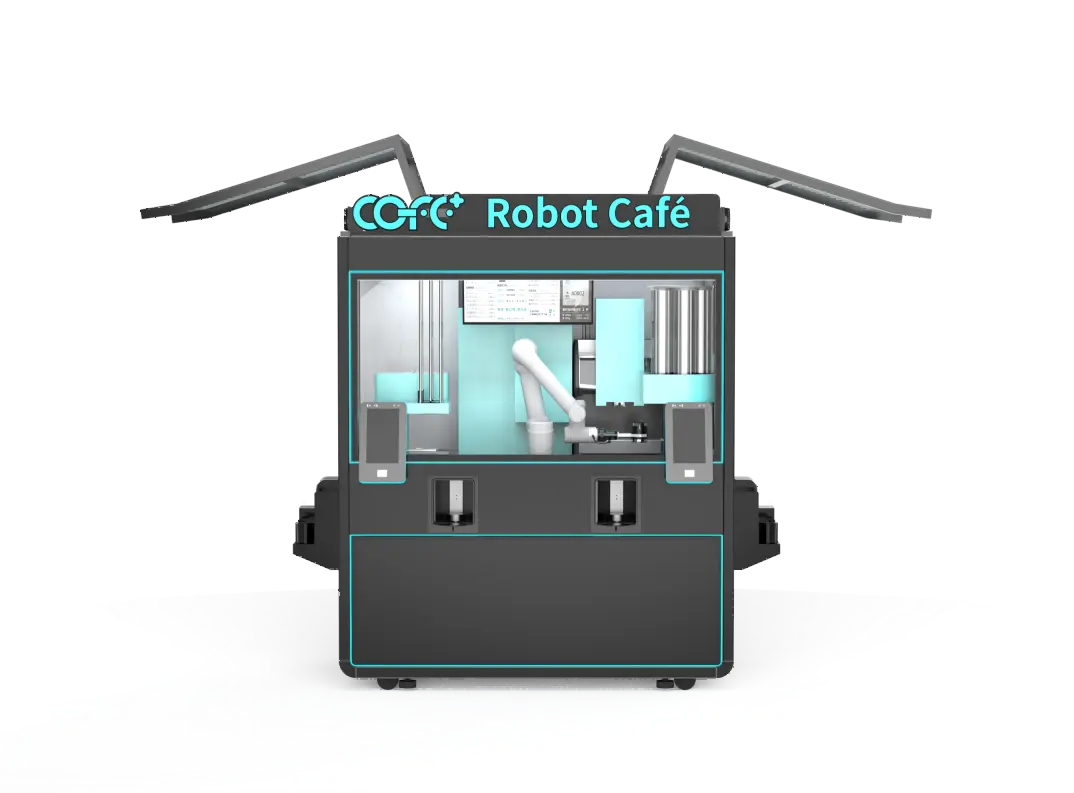
The most reliable starting point for a revenue model is a location-class benchmark for capture rate, the share of passing traffic that stops and purchases, converted into daily transactions. In an airport terminal beyond security, where captive passengers have time and limited alternatives, I use a capture rate of 1.5% to 3% of passing foot traffic during operating hours, varying with terminal layout and competing food outlets. A typical mid-sized terminal might see 8,000 relevant passersby near the kiosk zone in a day, giving a range of 120 to 240 transactions per day. At a university campus, the capture rate among the student population within a 200-meter radius is often lower, around 0.5% to 1.5%, but the daily repeat rate is higher, so a single kiosk serving a campus of 15,000 students might generate 75 to 225 transactions per day, with a wider spread depending on whether the kiosk is near the library versus a less-traveled housing block.
Once a transaction estimate is in place, apply the local menu price point. A robot coffee kiosk menu typically spans $2.50 for an Americano up to $6.50 for a specialty latte with 3D-printed art, and the effective AOV tends to land around $4.00 to $4.80 in most developed markets once upsells are factored in. Multiply daily transactions by AOV, and you have a daily revenue floor and ceiling that will already be more accurate than the industry-average models most operators rely on. The table below shows four representative location scenarios, with conservative and optimistic assumptions.
| Location Type | Daily Footfall (relevant) | Capture Rate | Daily Transactions | AOV (USD) | Daily Revenue Range |
|---|---|---|---|---|---|
| Airport terminal | 8,000–12,000 | 1.5%–3% | 120–360 | $4.50–$5.00 | $540–$1,800 |
| University campus | 5,000–15,000 | 0.5%–1.5% | 25–225 | $4.00–$4.50 | $100–$1,012 |
| Office tower lobby | 2,000–4,000 | 2%–5% | 40–200 | $4.00–$4.80 | $160–$960 |
| Outdoor public plaza | 3,000–10,000 | 0.5%–2% | 15–200 | $4.00–$4.50 | $60–$900 |
These ranges are wide for a reason. The difference between a kiosk placed on a major walkway and one tucked behind a pillar in the same building can be a 3x revenue factor, so any estimate that does not account for micro-placement is already off by multiples, not percentages.
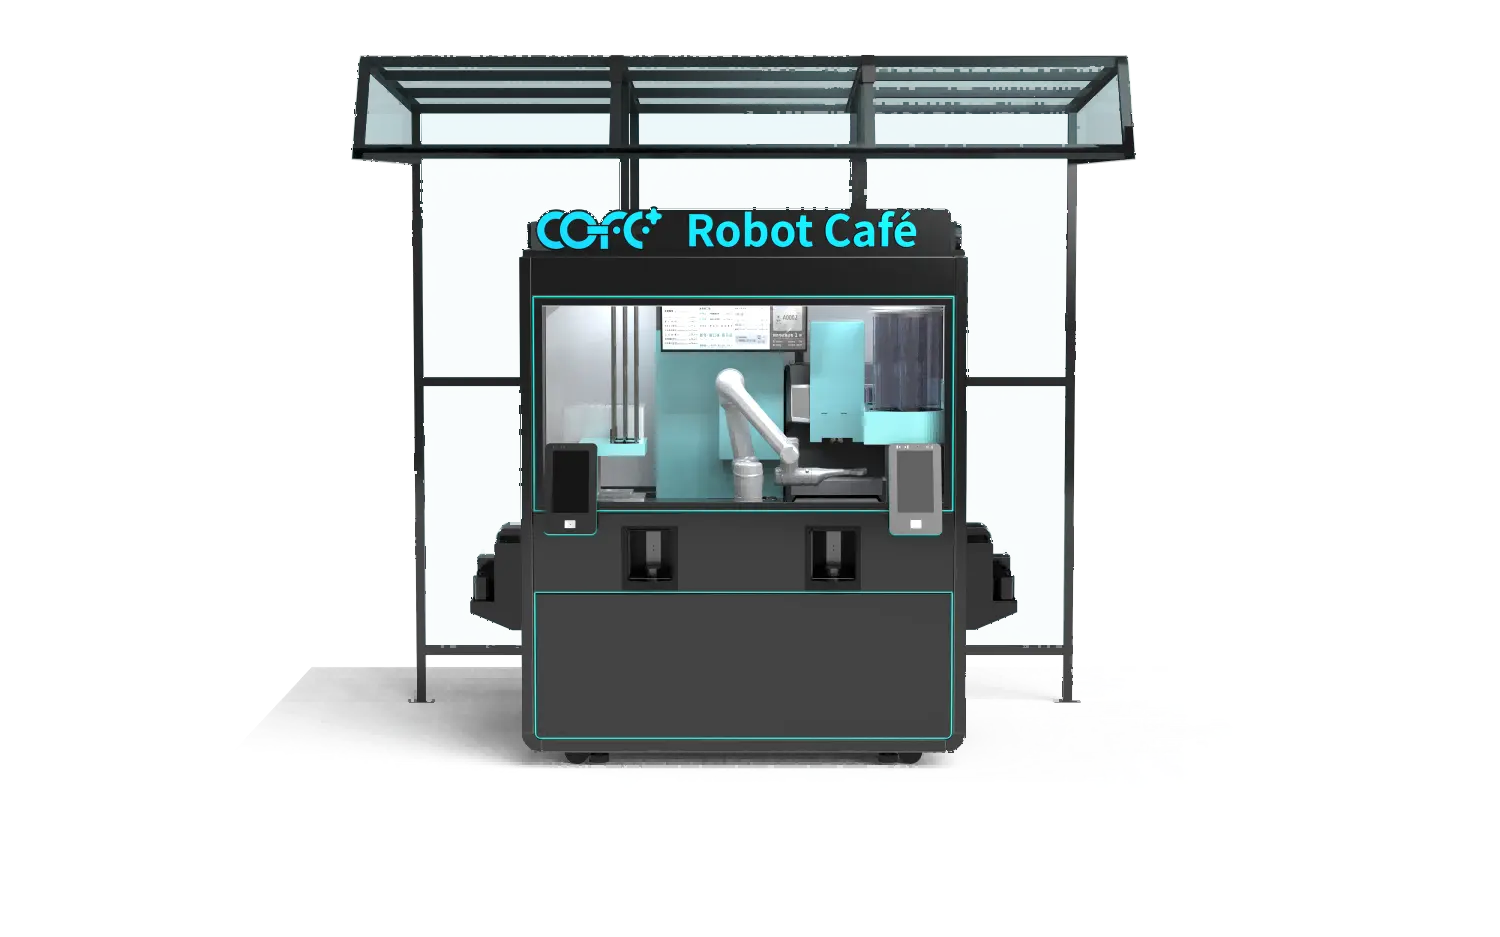
The operational cost structure of a robot coffee kiosk is what turns a revenue model into an investable proposition. In a traditional specialty coffee shop, the cost of goods sold (COGS) for ingredients and cups runs about 25% to 30%, but the dominant cost is labor, often 30% to 40% of revenue. Remove the barista, and the per-cup unit economics flip. With COFE+ units deployed across more than 30 countries, the all-in consumable cost per cup, including coffee beans, milk, syrups, cup, lid, and a small allocation for cleaning materials, sits between $0.30 and $0.70 depending on the drink complexity and local supply pricing. This means that at a $4.00 AOV, the gross margin on consumables alone is already above 80%, and the machine itself amortizes to a small fraction per cup across its 10-year design life and tested durability of over 500,000 cups.
This cost structure creates a revenue model where the break-even transaction count is so low that many sites considered borderline for a staffed café become viable. An indoor COFE+ kiosk placed in a building lobby that generates only 60 transactions per day at a $4.50 AOV produces roughly $8,100 in monthly revenue, with consumable costs around $1,260 (at $0.70 per cup) and virtually no incremental labor. After site rental, machine lease or amortization, and a small allocation for remote monitoring and periodic restocking visits, such a site can be cash-positive in its first month. I have seen this repeatedly in the field; the unit economics are not theoretical.
If your deployment involves multiple locations with varying footfall, it is wise to confirm the exact per-cup cost structure for your target country before locking in revenue projections, since dairy and packaging prices can diverge significantly by market. Reach out at sales@hi-dolphin.com for a country-specific consumables cost sheet that matches the COFE+ configuration you are evaluating.
A reliable forecast does not require a 30-tab spreadsheet; it requires getting the few dominant variables right. The process I teach distributors and operators follows four steps.
Identify the effective serving hours per day, not the hours the machine is powered on. A 24-hour kiosk in an office building might only generate meaningful sales between 7:00 AM and 7:00 PM, a 12-hour window. Subtract any daily downtime for automatic cleaning cycles and restocking; on COFE+ units, the high-temperature self-cleaning cycle takes less than 15 minutes and is scheduled outside peak hours, so effective downtime is negligible if the slot is chosen correctly.
Estimate the peak-hour throughput separately from the off-peak rate. During the morning rush, the machine’s cup-per-minute capacity sets the revenue cap. Off-peak, the constraint is footfall, not machine speed. A common forecasting error is averaging a 50-cup peak hour across a full day, which inflates the estimate. Instead, use a two-band model: peak hours with a hard service rate ceiling (typically 60–80 cups per hour) and off-peak hours driven by footfall capture. Sum the two.
Apply the local menu AOV based on comparable market data or a pilot test. In a new market, I recommend running a two-week pilot with a simplified menu and measuring actual AOV rather than relying on a competitor’s prices. The robot’s digital interface allows A/B testing of menu layouts, and even changing the default cup size or the placement of premium syrups on the first screen can shift AOV by $0.30 to $0.80 without altering the underlying product cost.
Multiply daily revenue by operating days per month and subtract a small buffer for any forced downtime. In practice, COFE+ machines we monitor through the cloud diagnostic system achieve uptime above 98%, but including a 2% revenue reserve for anomalies is prudent. This gives a forward-looking monthly revenue figure that can be tested against the cost model.
Revenue number alone does not answer the investment question; the timeline to net profit does. The most useful metric for a kiosk operator is months to full payback, not months to break-even on consumables. With a high-gross-margin machine like the COFE+, the unit shifts from covering ingredients to covering its own capex or lease fee very early, and the remaining fixed costs, site rental, internet, minor service visits, are typically modest enough that the net margin after consumables alone can exceed 60%.
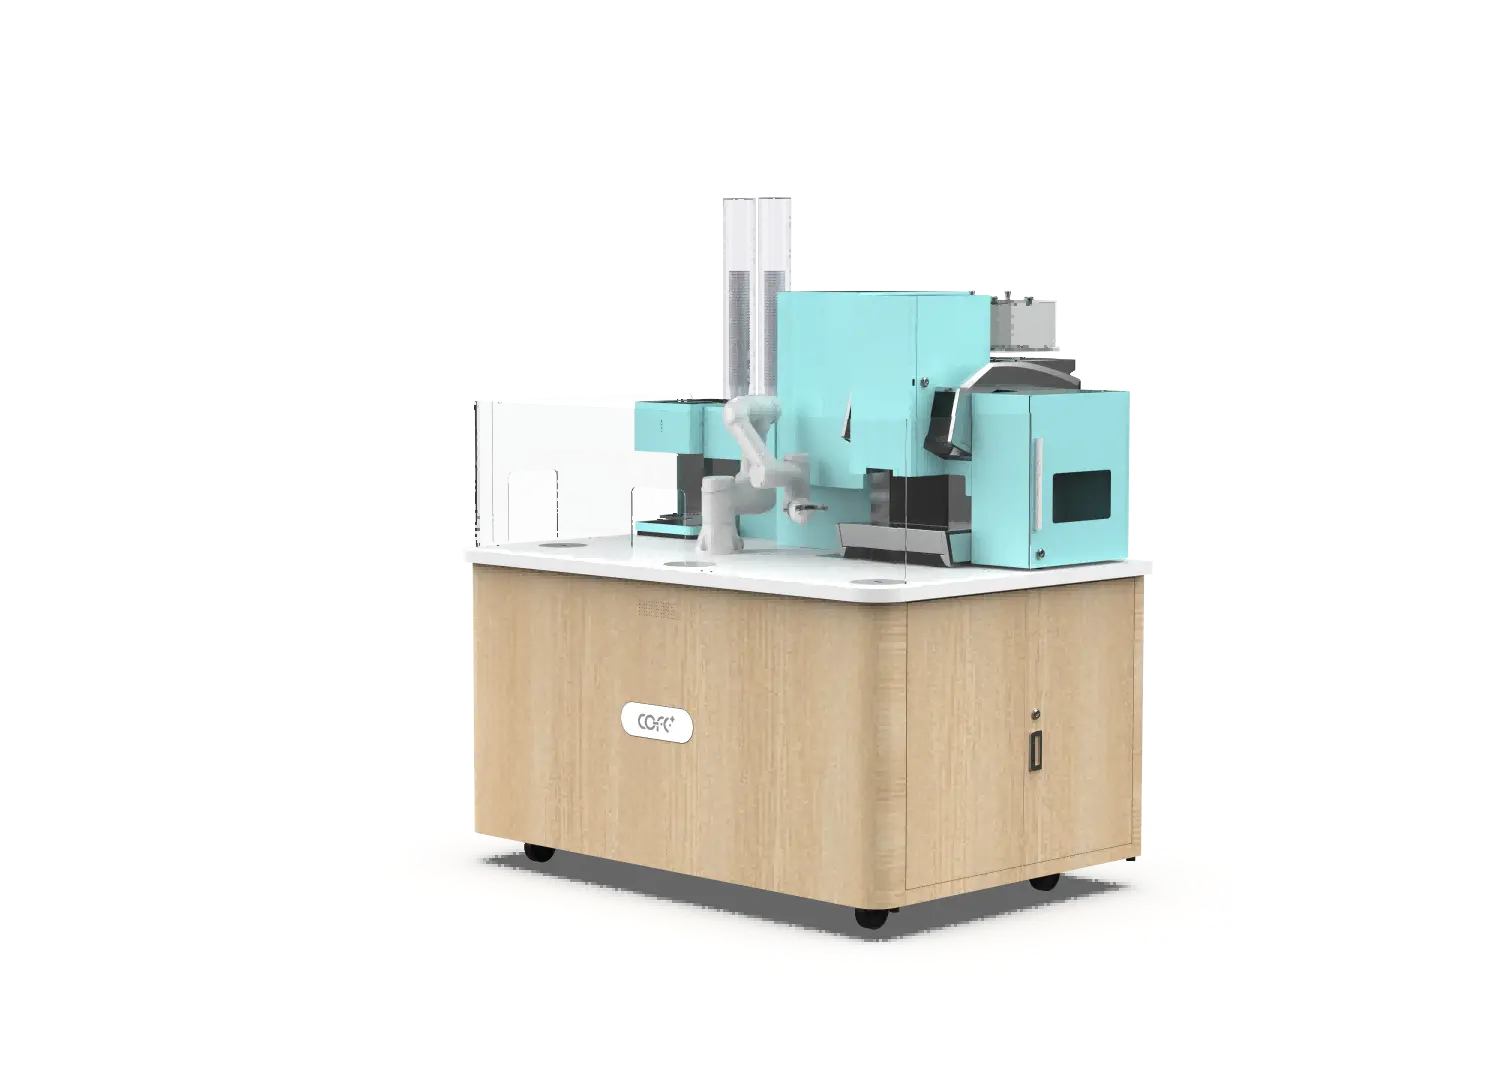
Consider the indoor COFE+ kiosk generating $8,100 monthly at the mid-range of the office tower scenario. Consumable costs at $0.50 per cup average on 1,800 cups per month total $900. Machine lease or amortization assuming a 5-year straight-line on a unit cost of roughly $25,000 runs about $417 per month, though actual models vary by purchase or lease structure. Site rental in a building lobby might be $500 to $1,500 depending on city and landlord. Adding all fixed and variable costs, total monthly outlay lands in the $2,000 to $3,000 range, leaving a net operating profit of over $5,000 per month. Payback on the machine investment occurs within six months in this profile, which aligns with the 6-to-12-month ROI range I consistently see in field deployments across Asia, the Middle East, and Europe.
Locations that underperform often do so not because the robot coffee kiosk concept is weak, but because the site’s micro-placement and menu were never tuned. I have relocated kiosks from a building’s secondary entrance to 30 meters away facing the elevator lobby and watched daily revenue triple within the first week. The business model is robust enough to absorb lower-revenue sites; the key is not to mistake a bad location for a weak unit economics model.
A single COFE+ unit can produce up to 1,000 cups per day under ideal conditions, which at a $4.50 AOV implies a daily revenue ceiling of $4,500, or about $135,000 monthly. In practice, no single location hits that ceiling because footfall and demand plateaus cap realized demand. But the comparison to a staffed shop is not about total revenue; it is about net profit per square foot. A staffed café might generate $30,000 monthly revenue but carry $25,000 in costs, leaving a thin margin, while a kiosk with $12,000 revenue and $3,000 in costs leaves a far higher net profit and zero staffing risk. The question is not whether revenue matches, but whether profit density improves, and it almost always does.
Outdoor kiosks see pronounced seasonal swings, but the effect is location-specific. In hot-climate cities like Dubai or Bangkok, demand for iced coffee drives strong daytime sales year-round, and the outdoor COFE+ unit with IP54 protection and an operating range from -20°C to 45°C continues serving without interruption. In temperate regions, winter months can reduce daily transactions by 30% to 50% unless the menu is adjusted toward hot specialty drinks and the kiosk is placed near a sheltered walkway. The revenue model must incorporate a seasonal multiplier drawn from local weather data, not a flat monthly average.
Within 30 days, you will have enough data to validate or correct the three main forecast variables: peak-hour throughput, AOV, and daily transaction count. The COFE+ cloud dashboard logs every transaction, every menu selection path, and every service interruption by time stamp. I recommend operators commit to a 30-day observation window without significant menu changes, then run a revision to the revenue model, adjust either placement or pricing, and lock in the forecast for the remaining quarter. This approach has turned initial revenue estimates that were off by 25% into models accurate within 5% by day 60.
The difference is not in the underlying math but in the hour-by-hour demand shape and the pricing ceiling. In a transit hub, the window for capturing revenue is extremely compressed, sometimes 90 to 120 minutes of high-intensity demand morning and evening, and those peak hours require a menu flow optimized for speed, with fewer customization steps and larger default cup sizes to keep AOV up while serving volume. In a hospital, demand is spread across 18 hours, and customers are more receptive to premium upsells like latte art and plant-based milk alternatives, so AOV tends to be higher, but the daily transaction ceiling is lower. The forecasting approach must separate these two location archetypes at the model level rather than blending them.
The revenue estimation model I have outlined works across location types when you respect the demand shape, not just the daily total. Before locking in a site, model both the fast-serve and stable-flow scenarios and check that the economics hold under the lower of the two. For a site-specific revenue projection calibrated to your target city and COFE+ configuration, share your candidate location type and expected footfall range with our team at sales@hi-dolphin.com or call +86 131 6630 1290.
TL;DR — COFE+ is a fully automated robotic coffee kiosk that grinds fresh beans, brews espresso and lattes, creates latt……
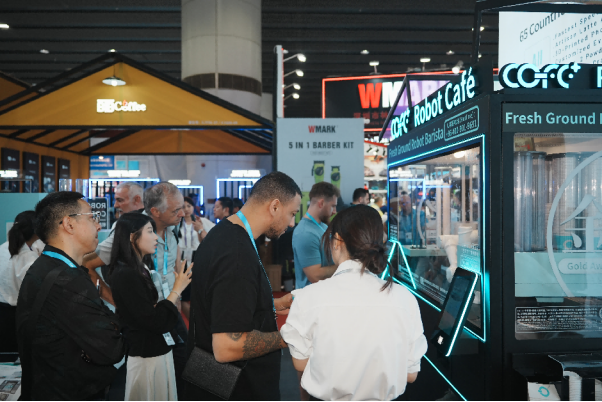
7th-Genertion Smart Robot Coffee Kiosk Arrives at the Belt and Road Core Hub, Ushering in a New Service Era Along t……
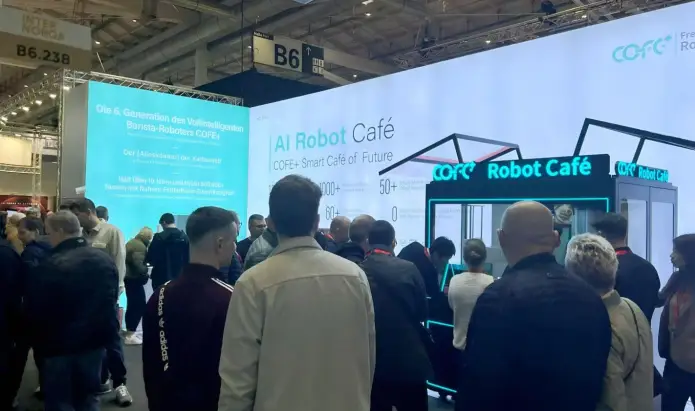
CHICAGO, May 12, 2026 (GLOBE NEWSWIRE) – Shanghai Hi-Dolphin Robot Technology today announced the U.S. debut of its 7th‑……