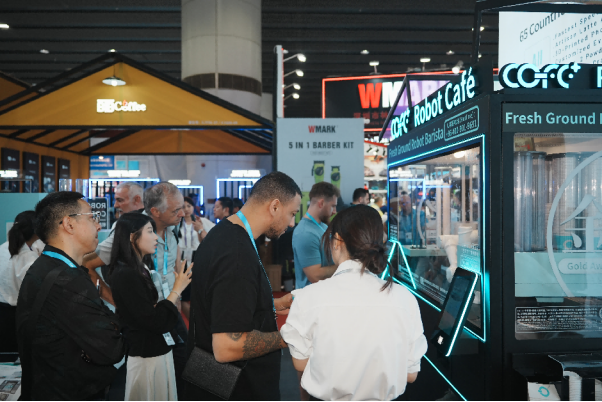
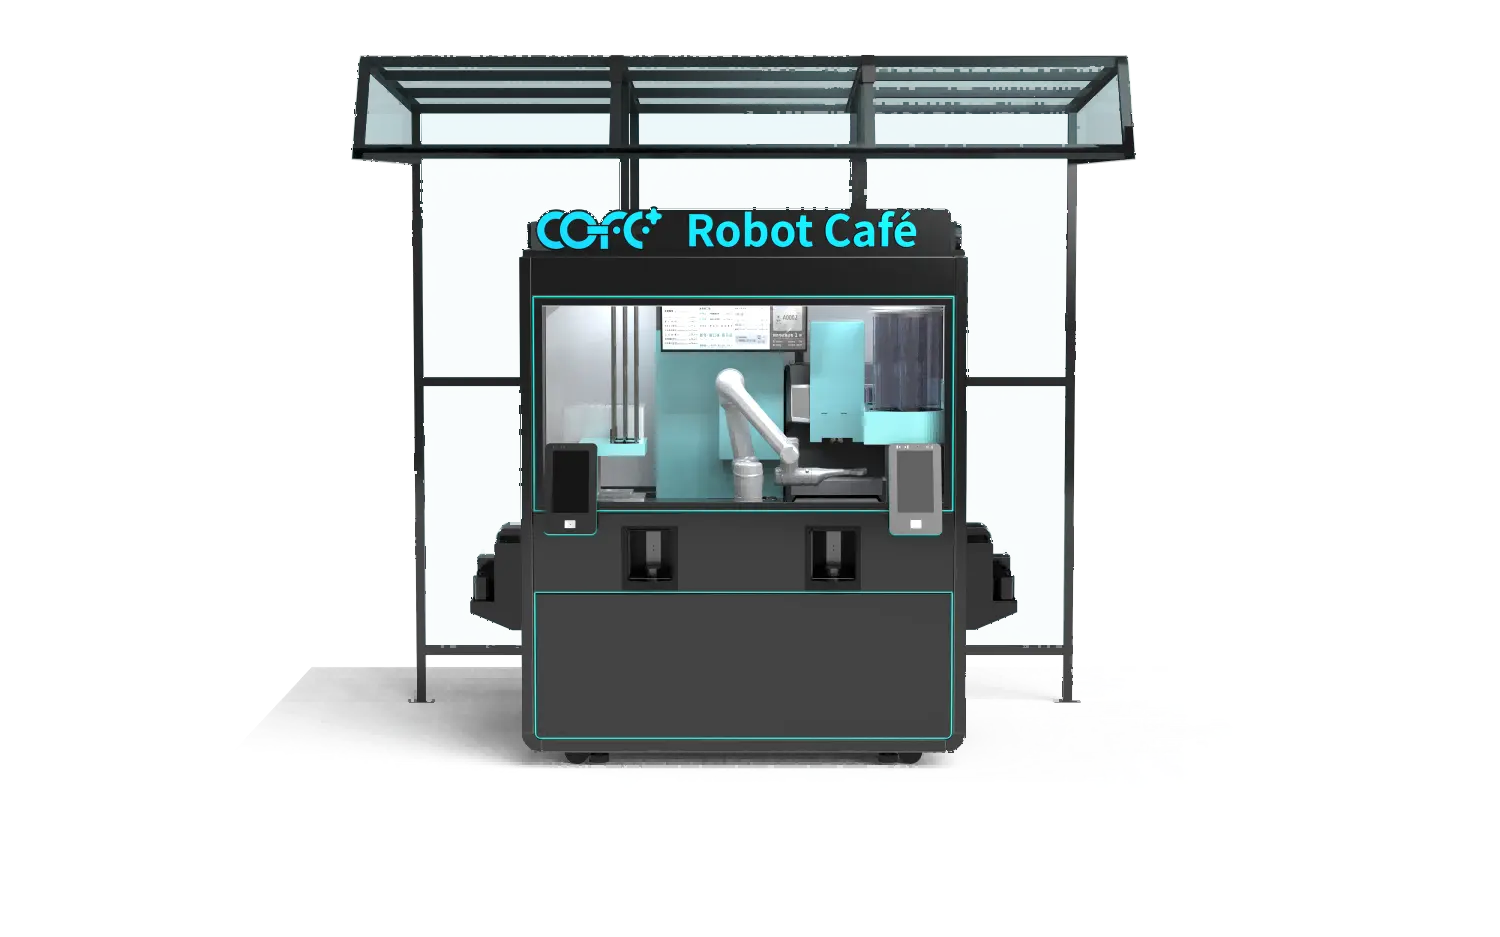
World’s No.1 Robot Café COFE+ Makes Its Debut at Urumqi Diwopu International Airport in Xinjiang
7th-Genertion Smart Robot Coffee Kiosk Arrives at the Belt and Road Core Hub, Ushering in a New Service Era Along t……
A robot coffee kiosk does more than grind beans and pull shots. Every cup it serves generates a stream of operational data that, when properly harnessed, changes how operators make decisions about inventory, pricing, maintenance, and site selection. Most discussions of robotic coffee technology stop at labor savings and drink consistency. But the data layer—the IoT sensors, transaction logs, and AI analytics running behind each kiosk—is what separates a machine that replaces a barista from a system that continuously improves a business. For operators evaluating unattended retail, understanding this data pipeline is the difference between buying a vending machine and acquiring an intelligence asset.
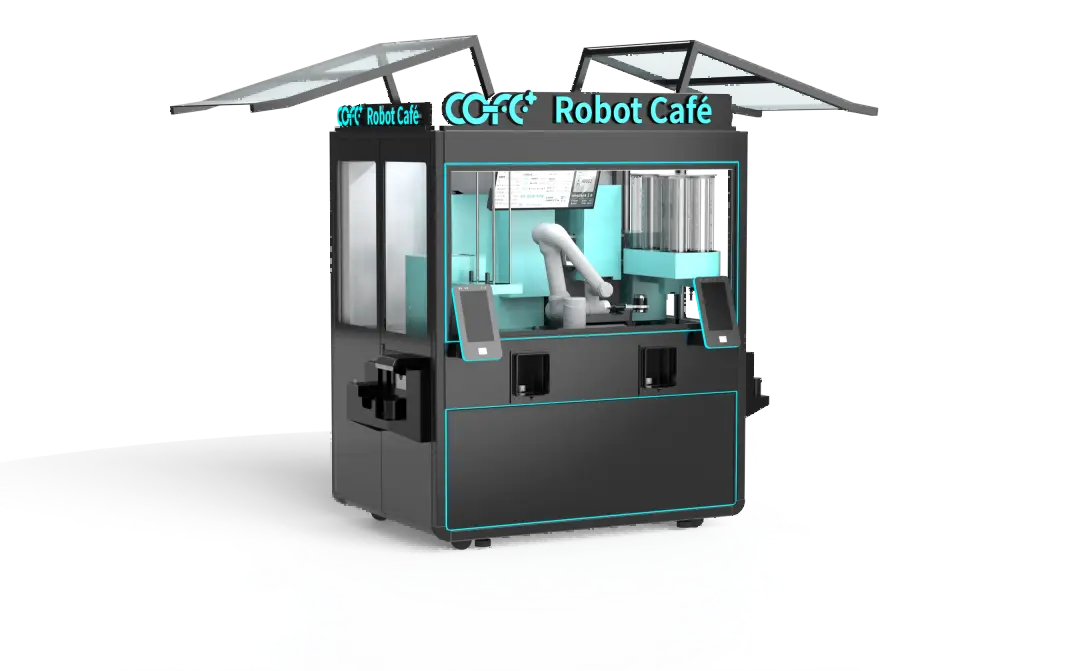
Robot coffee kiosks are instrumented at multiple touchpoints, and each generates structured data that feeds into a centralized cloud platform. The data categories fall into three groups.
Transaction-level data captures every sale: time stamp, drink selection, customizations including milk type, syrup additions, roast preference, and cup size, payment method, and transaction duration. Over weeks of operation, this reveals drink popularity curves by hour, day, and season. A COFE+ kiosk serving 300+ drink varieties across 197 country-inspired recipes generates granular preference data that a manual café’s POS system rarely captures at the same resolution.
Customer behavior metrics extend beyond the purchase. Touchscreen interaction logs show how long users browse before selecting, which menu items they hover over but do not buy, and whether they return to previous screens. External sensors track approach-and-walk-away rates, capturing people who looked at the kiosk but did not purchase. This pre-transaction data is invisible to traditional coffee shops.
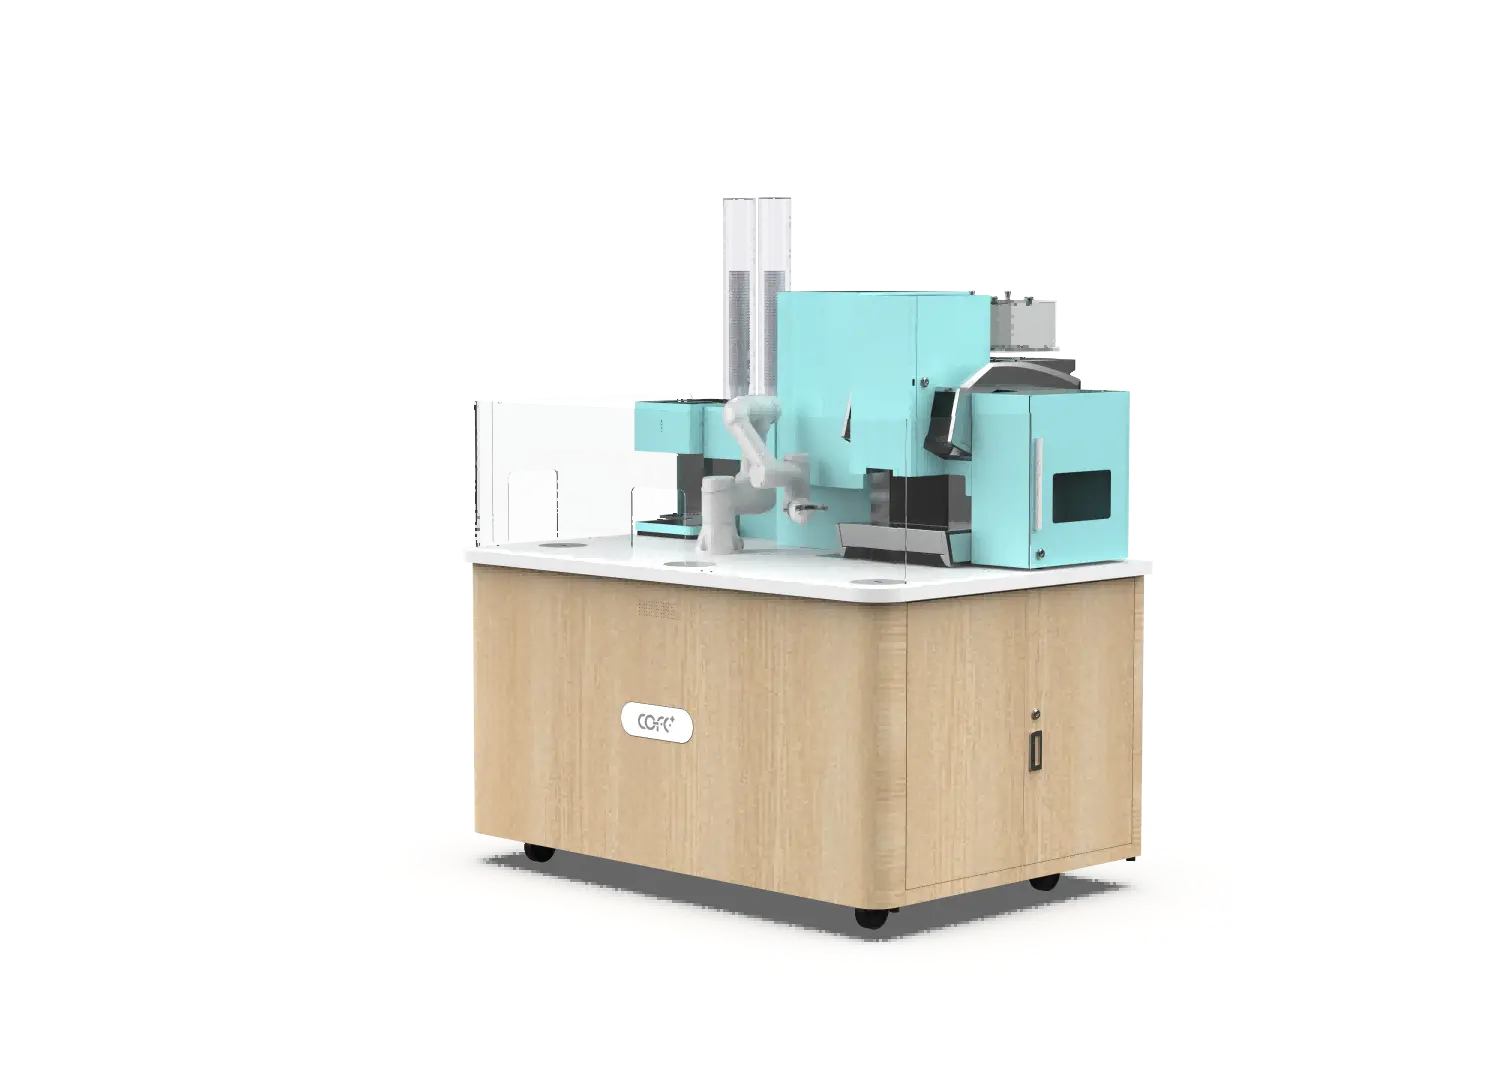
Machine performance telemetry runs continuously: water temperature at each extraction, grinder motor current draw, milk refrigeration temperature, bean hopper levels, waste bin fullness, and component cycle counts. The kiosk monitors its own health across hundreds of parameters, logging every anomaly before it becomes a failure.
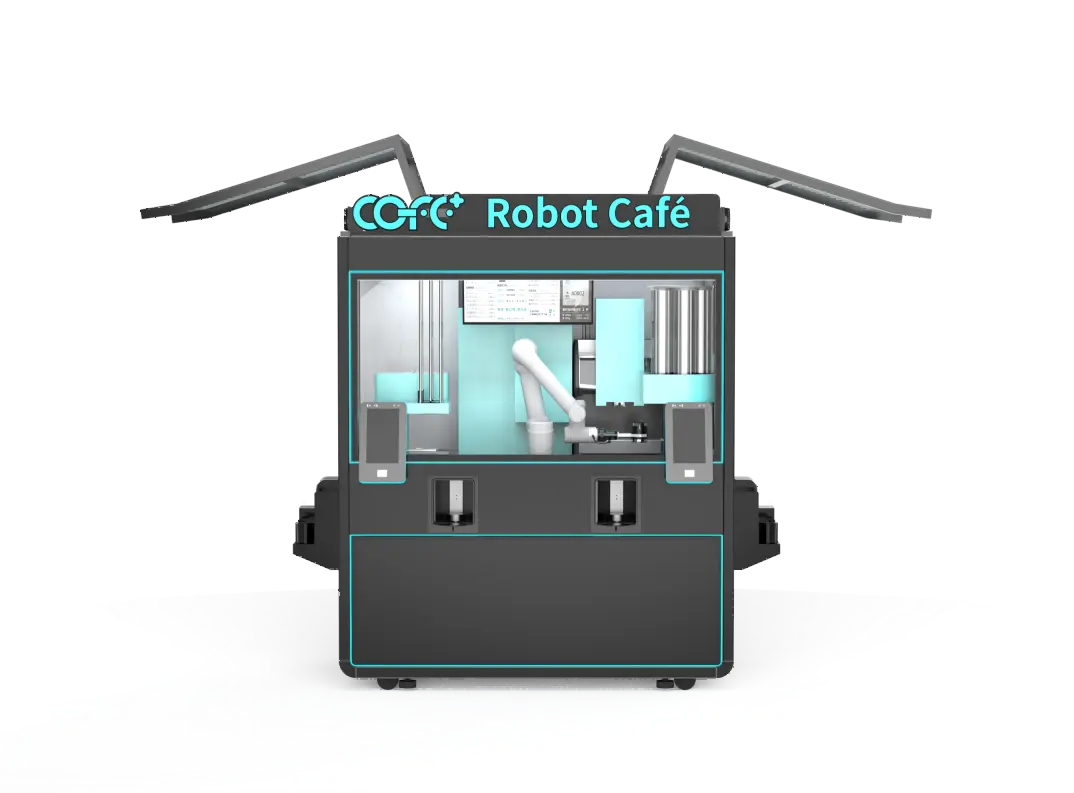
The sensor architecture inside a robot coffee kiosk is what converts mechanical operations into digital business signals. This is not a simple on/off monitoring layer. It is a dense IoT network designed for unattended reliability.
Three sensor categories work in parallel. Environmental sensors track ambient temperature, humidity, and air quality around the kiosk, which matters for outdoor deployments where condensation or heat can affect equipment longevity. Ingredient sensors monitor bean freshness through optical inspection, milk temperature through embedded thermocouples, and syrup viscosity through flow-rate measurement. Mechanical sensors measure vibration signatures from grinders and pumps, pressure curves during extraction, and motor current on every actuated component.
The critical architectural decision is edge processing. Raw sensor data is too voluminous to stream entirely to the cloud. The kiosk’s onboard processor filters and aggregates, comparing current vibration signatures against baseline profiles and flagging deviations rather than sending every reading. When a grinder motor draws 15% more current than its 30-day rolling average, the system generates an alert before the operator notices any taste difference in the cup. This predictive threshold logic is what prevents 2:00 AM breakdowns at an unattended location.
In our deployments across 35+ countries, the sensor network has proven as valuable for business operations as for machine maintenance. A kiosk in a Dubai shopping mall detected a pattern of increased milk waste during afternoon hours, not because of machine fault, but because the local preference shifted toward iced Americanos after 2 PM. The data surfaced a menu-optimization opportunity that no human operator would have caught without weeks of manual observation.
Collecting data is the easy part. The value emerges when AI analytics correlate streams that look unrelated and surface patterns a human operator would miss.
The analytics engine operates on three layers. The first is descriptive analytics: dashboards that show what happened—cups per hour, top-selling drinks, average transaction value, peak demand windows. This is table-stakes reporting that any competent POS system provides.
The second layer, diagnostic analytics, asks why it happened. When Tuesday afternoon sales drop 18% compared to the four-week rolling average, the engine cross-references: was it weather? A local event? A menu change? The system checks external data feeds including weather API and local holiday calendars alongside internal telemetry. If bean hopper refill logs show the kiosk was offline for 12 minutes that afternoon due to a maintenance cycle, the platform attributes the revenue dip and excludes that anomaly from forecasting models.
The third layer, predictive analytics, is where ROI concentrates. Using six to eight weeks of location-specific data, the system builds demand forecasts at hourly granularity. It predicts that the kiosk near a university library will spike at 9:45 PM during exam weeks but taper at 8:00 PM during summer sessions. Inventory recommendations adjust automatically: order 40% more oat milk for that location in May and December, reduce whole milk by 15% in July. These are not generic rules. They are machine-learning outputs trained on each kiosk’s actual consumption patterns.
What makes this operational rather than theoretical is the closed-loop design. When the AI recommends stocking more iced latte cups on Wednesday mornings and the operator accepts that recommendation, the following Wednesday’s sales data feeds back into the model, refining the next prediction. The system learns continuously from its own recommendations.
If your operation spans multiple kiosk formats, the analytics layer becomes the unifying management plane. It is worth confirming during vendor evaluation that the platform supports cross-format comparison before committing to a fleet deployment, since not all analytics platforms handle indoor, outdoor, and counter-integrated units within a single dashboard.
Data without a decision is overhead. The following are specific operational decisions that robot coffee kiosk data makes more precise, faster, or entirely possible.
Inventory and supply chain decisions are the most immediate win. Instead of restocking on a fixed schedule of Monday, Wednesday, and Friday, operators receive dynamic replenishment alerts. When the kiosk at a transit station sells through 80% of its milk inventory by 4:00 PM on a Friday, the system triggers a Saturday morning restock rather than waiting until Monday. Over a year, this dynamic approach typically reduces waste from expired ingredients by 20 to 30 percent compared to fixed-schedule restocking, because inventory turns match actual demand curves rather than calendar assumptions.
Menu and pricing optimization becomes data-driven rather than instinct-driven. The kiosk logs every drink order with full customization details. After three months, the data might reveal that adding oat milk as a default option on the quick-select screen increases oat milk attach rate by 40%, or that a seasonal chestnut latte priced slightly below the standard latte outsells it three to one. These are testable hypotheses rather than guesses. The platform supports A/B testing: run two pricing configurations across different days or locations and measure conversion impact directly.
Site performance comparison is uniquely enabled by the data architecture. A chain operator with 20 kiosks across shopping malls, hospitals, and university campuses can compare revenue per kiosk, cups per hour, and margin per cup across locations on identical dashboards. The data tells you which site types underperform, which overperform, and why. One operator we work with discovered that their hospital-lobby kiosk sold 60% more milk tea than their shopping-mall kiosk, a demographic insight that reshaped their site-selection criteria for the next three deployments.
| Decision Type | Without Kiosk Data | With Kiosk Data |
|---|---|---|
| Restock schedule | Fixed calendar, same days weekly | Dynamic, demand-triggered |
| Menu changes | Quarterly, based on intuition | Continuous A/B testing |
| Site evaluation | Monthly revenue report | Hourly performance by metric |
| Maintenance | Reactive, after breakdown | Predictive, before failure |
| Pricing | Static across locations | Location-optimized |
The data layer compresses the payback period through three mechanisms that compound rather than simply add up.
The first is waste reduction, which directly improves gross margin. When ingredient restocking matches actual consumption, expired milk, syrup, and beans drop measurably. For a kiosk serving 200 to 300 cups daily with a per-cup ingredient cost of roughly $0.30 to $0.70, reducing waste by even 10% saves several thousand dollars annually per unit. Across a fleet of ten kiosks, that difference is material.
The second is revenue uplift from optimized operations. Dynamic menu adjustments—promoting iced drinks during heat waves, switching default milk options based on local preference data—typically yield a 5 to 15 percent same-store sales lift within the first quarter of data-driven operation. Because the kiosk operates 24/7 without staff, every additional cup sold during a previously slow hour goes almost entirely to margin. The data identifies those slow hours and the AI recommends the fix.
The third is maintenance cost avoidance and uptime preservation. Predictive maintenance prevents the cascade failures that occur when one worn component stresses its neighbors. A grinder burr replacement scheduled during a low-traffic window costs far less than an emergency service call at midnight when the same burr seizes, damages the motor, and takes the kiosk offline for three days during a holiday weekend. The uptime difference between 99% and 94% translates to roughly 18 additional serving days per year per kiosk. At 200 to 1,000 cups per day, that is thousands of cups of revenue not lost to downtime.
In ROI models I have reviewed, operators who actively use the analytics platform typically reach break-even 20 to 30 percent faster than those who treat the kiosk as a standalone machine and ignore the data feed. The payback period for a COFE+ unit normally ranges from 6 to 12 months depending on location and throughput. Active data utilization pulls that toward the lower end of the range, not because the machine works harder, but because the operator works smarter.
Not every operator needs a fleet-wide analytics dashboard on day one. But if you are evaluating a robot coffee kiosk investment and the manufacturer’s data capabilities stop at a basic sales report, you are leaving the most valuable part of the system unused. Before committing to a vendor, ask for a walkthrough of their analytics platform: what data streams are available, how the AI generates recommendations, and whether the system supports multi-site comparison. The hardware matters. The data layer determines whether that hardware generates returns year after year or plateaus after the first six months. For operators and distributors evaluating COFE+ kiosk deployments, share your target location profile and deployment scale with our team at sales@hi-dolphin.com or call +86 131 6630 1290, and we will walk through the data scenarios specific to your operating model.
The data architecture uses end-to-end encryption for all transmissions between the kiosk and cloud platform. Payment data is tokenized and processed through PCI-compliant gateways. The kiosk never stores raw card numbers. Operational data including sales, inventory, and machine telemetry resides in isolated tenant databases, so multi-site operators see only their own locations. For enterprise deployments, on-premises data hosting options exist alongside standard cloud configurations. The security model is designed for unattended operation in public spaces, which means it is tested against both physical and network intrusion vectors.
In the deployments I have evaluated, the analytics dashboard is designed for operators, not data scientists. Pre-built reports cover the core decisions—inventory alerts, peak hour forecasts, maintenance notifications—without requiring any configuration. The system flags anomalies automatically rather than expecting you to hunt through spreadsheets. That said, operators who invest an hour in understanding the customization options, such as setting alert thresholds and configuring A/B pricing tests, extract significantly more value from the same data. The baseline is plug-and-play reporting. The upside comes from engaging with the platform’s deeper features.
A common assumption is that kiosk data takes months to become useful. In practice, meaningful patterns start emerging at roughly four to six weeks of operation, which is when the system has enough transaction volume to distinguish weekly cycles from random variation. Location-specific demand forecasts become reliable at around eight weeks. The first month is essentially a calibration period: the AI learns baseline demand curves, establishes normal operating ranges for all sensors, and begins correlating external factors like weather and local events. Operators see basic reporting from day one including cups sold, revenue, and popular drinks, but the predictive features that drive ROI require that initial learning period.
Integration depends on your existing software environment. Modern cloud-based ERP, inventory management, and accounting tools typically connect with minimal configuration through standard APIs. Sales data can flow directly into financial reporting. Inventory alerts can trigger purchase orders in your procurement system. Older on-premises systems may require middleware, and the integration depth varies accordingly. In programs involving multiple existing business applications, mapping integration points during the deployment planning phase rather than after installation saves rework and delay. Share your requirements and system specifications at sales@hi-dolphin.com and we will confirm integration compatibility for your specific technology stack.
7th-Genertion Smart Robot Coffee Kiosk Arrives at the Belt and Road Core Hub, Ushering in a New Service Era Along t……
CHICAGO, May 12, 2026 (GLOBE NEWSWIRE) – Shanghai Hi-Dolphin Robot Technology today announced the U.S. debut of its 7th‑……

SHANGHAI, April 1, 2026 (GLOBE NEWSWIRE) — Shanghai Hi-Dolphin Robot Technology Co., Ltd. (“Hi-Dolphin Robotics”) ……